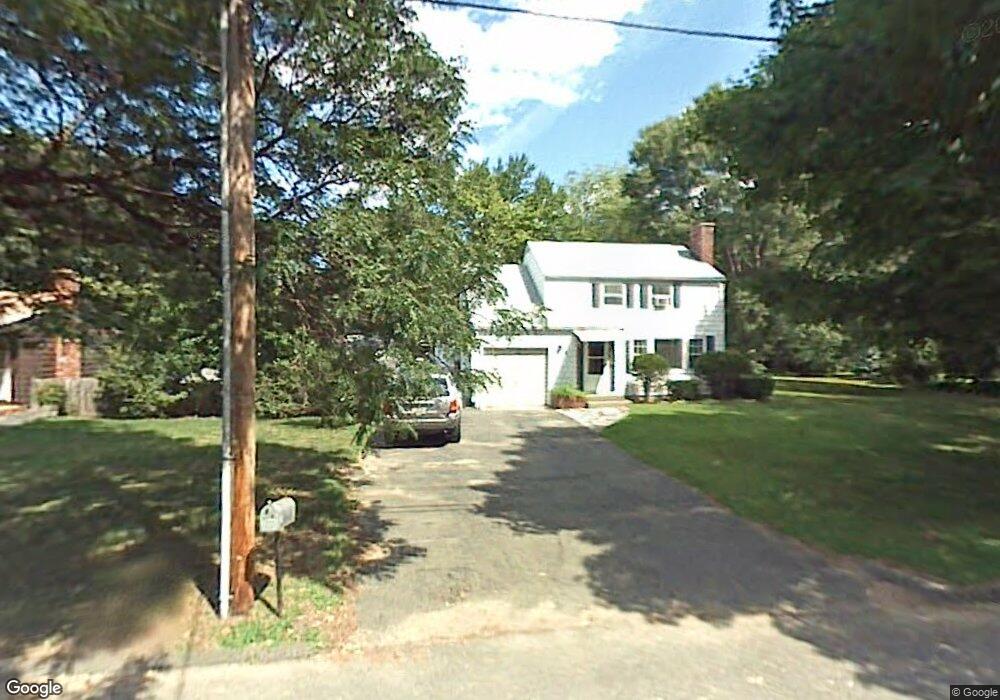
81 Donbray Rd Springfield, MA 01119
Sixteen Acres NeighborhoodEstimated Value: $322,000 - $355,000
3
Beds
2
Baths
1,338
Sq Ft
$249/Sq Ft
Est. Value
About This Home
This home is located at 81 Donbray Rd, Springfield, MA 01119 and is currently estimated at $333,053, approximately $248 per square foot. 81 Donbray Rd is a home located in Hampden County with nearby schools including Glickman Elementary, John J Duggan Middle, and Springfield High School of Science and Technology.
Ownership History
Date
Name
Owned For
Owner Type
Purchase Details
Closed on
Jan 15, 2016
Sold by
Deutsche Bank Natl T C
Bought by
Reejhsinghani Bharati N
Current Estimated Value
Purchase Details
Closed on
Aug 5, 2015
Sold by
Crawford Maria
Bought by
Deutsche Bk Natl T Co
Purchase Details
Closed on
Apr 20, 2006
Sold by
Nader Michael K A and Nader Christine N
Bought by
Crawford Maria
Home Financials for this Owner
Home Financials are based on the most recent Mortgage that was taken out on this home.
Original Mortgage
$140,800
Interest Rate
6.37%
Mortgage Type
Purchase Money Mortgage
Create a Home Valuation Report for This Property
The Home Valuation Report is an in-depth analysis detailing your home's value as well as a comparison with similar homes in the area
Home Values in the Area
Average Home Value in this Area
Purchase History
| Date | Buyer | Sale Price | Title Company |
|---|---|---|---|
| Reejhsinghani Bharati N | $103,000 | -- | |
| Deutsche Bk Natl T Co | $148,000 | -- | |
| Crawford Maria | $176,000 | -- |
Source: Public Records
Mortgage History
| Date | Status | Borrower | Loan Amount |
|---|---|---|---|
| Previous Owner | Crawford Maria | $140,800 | |
| Previous Owner | Crawford Maria | $35,200 |
Source: Public Records
Tax History Compared to Growth
Tax History
| Year | Tax Paid | Tax Assessment Tax Assessment Total Assessment is a certain percentage of the fair market value that is determined by local assessors to be the total taxable value of land and additions on the property. | Land | Improvement |
|---|---|---|---|---|
| 2025 | $4,558 | $290,700 | $54,400 | $236,300 |
| 2024 | $4,484 | $279,200 | $54,400 | $224,800 |
| 2023 | $4,228 | $248,000 | $51,800 | $196,200 |
| 2022 | $4,172 | $221,700 | $51,800 | $169,900 |
| 2021 | $3,701 | $195,800 | $47,100 | $148,700 |
| 2020 | $3,588 | $183,700 | $47,100 | $136,600 |
| 2019 | $3,430 | $174,300 | $47,100 | $127,200 |
| 2018 | $3,493 | $177,500 | $47,100 | $130,400 |
| 2017 | $3,511 | $178,600 | $46,800 | $131,800 |
| 2016 | $3,321 | $168,900 | $46,800 | $122,100 |
| 2015 | $2,998 | $152,400 | $46,800 | $105,600 |
Source: Public Records
Map
Nearby Homes