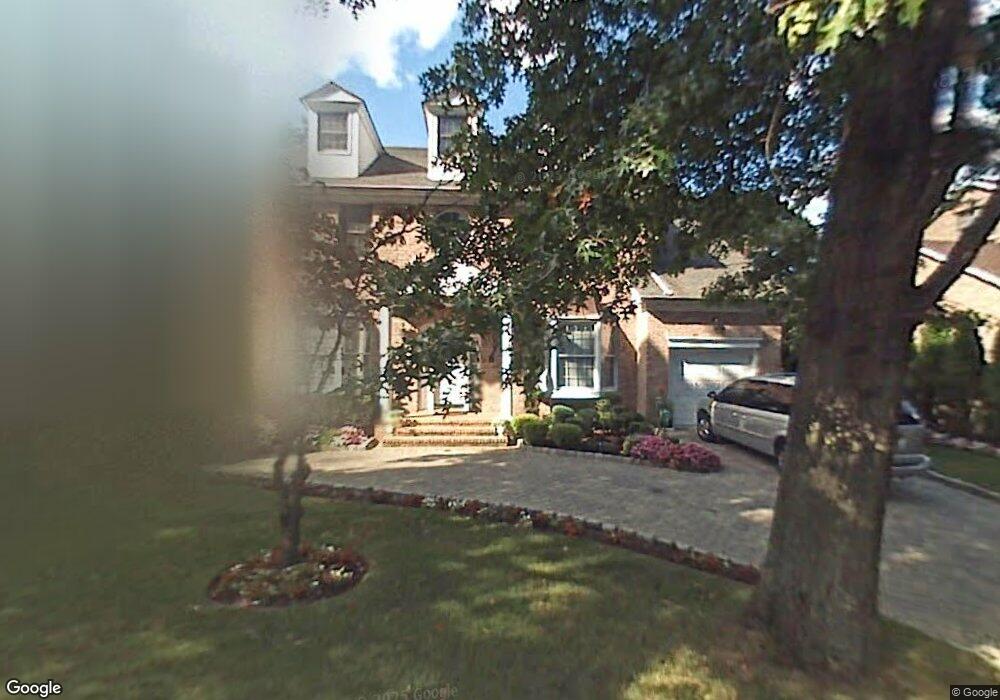
81 E Loop Rd Staten Island, NY 10304
Todt Hill NeighborhoodEstimated Value: $1,901,534 - $2,571,000
6
Beds
5
Baths
4,814
Sq Ft
$453/Sq Ft
Est. Value
About This Home
This home is located at 81 E Loop Rd, Staten Island, NY 10304 and is currently estimated at $2,181,845, approximately $453 per square foot. 81 E Loop Rd is a home located in Richmond County with nearby schools including P.S. 11 Thomas Dongan School, Is 2 George L Egbert, and New Dorp High School.
Ownership History
Date
Name
Owned For
Owner Type
Purchase Details
Closed on
Sep 16, 2005
Sold by
Maiellano Rocco and Maiellano Christine
Bought by
Aggarwal Parveen K and Aggarwal Ritu
Current Estimated Value
Home Financials for this Owner
Home Financials are based on the most recent Mortgage that was taken out on this home.
Original Mortgage
$1,033,500
Interest Rate
6.39%
Mortgage Type
Fannie Mae Freddie Mac
Purchase Details
Closed on
Feb 2, 2005
Sold by
Criro Inc
Bought by
Maiellano Rocco and Maiellano Christiane
Create a Home Valuation Report for This Property
The Home Valuation Report is an in-depth analysis detailing your home's value as well as a comparison with similar homes in the area
Home Values in the Area
Average Home Value in this Area
Purchase History
| Date | Buyer | Sale Price | Title Company |
|---|---|---|---|
| Aggarwal Parveen K | $1,590,000 | The Judicial Title Insurance | |
| Maiellano Rocco | -- | -- |
Source: Public Records
Mortgage History
| Date | Status | Borrower | Loan Amount |
|---|---|---|---|
| Previous Owner | Aggarwal Parveen K | $1,033,500 |
Source: Public Records
Tax History Compared to Growth
Tax History
| Year | Tax Paid | Tax Assessment Tax Assessment Total Assessment is a certain percentage of the fair market value that is determined by local assessors to be the total taxable value of land and additions on the property. | Land | Improvement |
|---|---|---|---|---|
| 2025 | $17,857 | $126,840 | $19,035 | $107,805 |
| 2024 | $17,857 | $103,620 | $21,982 | $81,638 |
| 2023 | $17,758 | $87,437 | $22,863 | $64,574 |
| 2022 | $16,731 | $98,880 | $25,620 | $73,260 |
| 2021 | $17,519 | $90,960 | $25,620 | $65,340 |
| 2020 | $28,431 | $87,960 | $25,620 | $62,340 |
| 2019 | $15,498 | $76,440 | $25,620 | $50,820 |
| 2018 | $14,853 | $72,864 | $22,894 | $49,970 |
| 2017 | $14,237 | $69,840 | $25,620 | $44,220 |
| 2016 | $13,868 | $69,370 | $21,637 | $47,733 |
| 2015 | $11,849 | $65,444 | $19,529 | $45,915 |
| 2014 | $11,849 | $61,740 | $21,360 | $40,380 |
Source: Public Records
Map
Nearby Homes