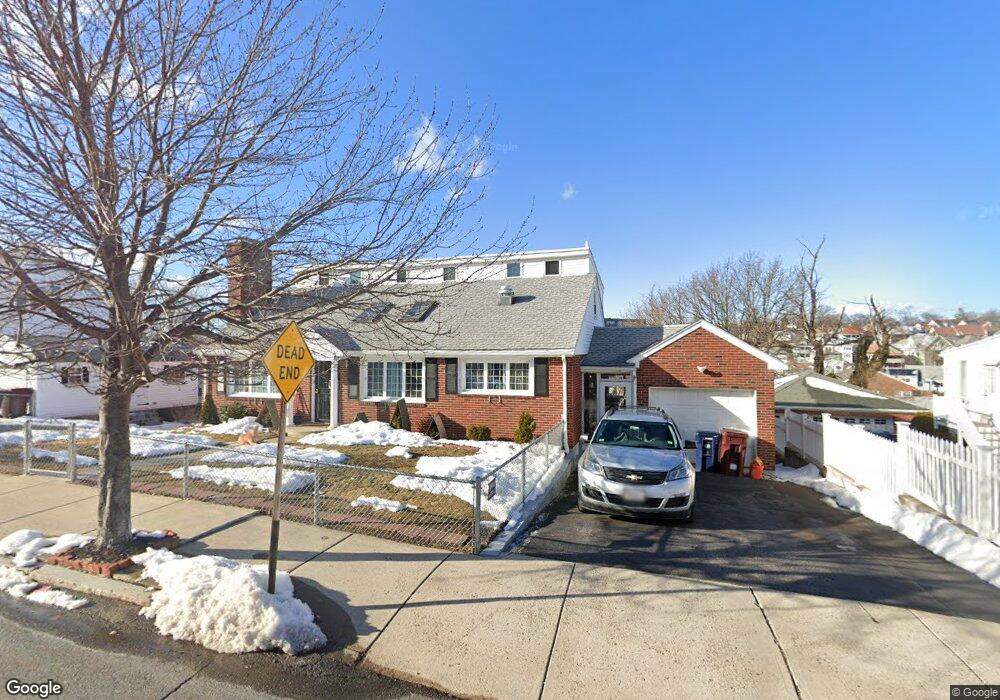
81 Elsie St Unit 1 Everett, MA 02149
Glendale NeighborhoodEstimated Value: $1,057,728 - $1,158,000
2
Beds
1
Bath
1,286
Sq Ft
$860/Sq Ft
Est. Value
About This Home
This home is located at 81 Elsie St Unit 1, Everett, MA 02149 and is currently estimated at $1,105,432, approximately $859 per square foot. 81 Elsie St Unit 1 is a home located in Middlesex County with nearby schools including Everett High School and Pioneer Charter School of Science.
Ownership History
Date
Name
Owned For
Owner Type
Purchase Details
Closed on
Feb 10, 2025
Sold by
Cornelio Sergio and Cornelio Kilsary L
Bought by
Central Ave Realty Llc
Current Estimated Value
Purchase Details
Closed on
Nov 21, 2022
Sold by
Marchese Carol M
Bought by
Cornelio Sergio
Home Financials for this Owner
Home Financials are based on the most recent Mortgage that was taken out on this home.
Original Mortgage
$636,500
Interest Rate
6.94%
Mortgage Type
Purchase Money Mortgage
Create a Home Valuation Report for This Property
The Home Valuation Report is an in-depth analysis detailing your home's value as well as a comparison with similar homes in the area
Home Values in the Area
Average Home Value in this Area
Purchase History
| Date | Buyer | Sale Price | Title Company |
|---|---|---|---|
| Central Ave Realty Llc | $1,020,000 | None Available | |
| Cornelio Sergio | $670,000 | None Available |
Source: Public Records
Mortgage History
| Date | Status | Borrower | Loan Amount |
|---|---|---|---|
| Previous Owner | Cornelio Sergio | $636,500 |
Source: Public Records
Tax History
| Year | Tax Paid | Tax Assessment Tax Assessment Total Assessment is a certain percentage of the fair market value that is determined by local assessors to be the total taxable value of land and additions on the property. | Land | Improvement |
|---|---|---|---|---|
| 2025 | $10,208 | $896,200 | $306,500 | $589,700 |
| 2024 | $8,871 | $774,100 | $279,200 | $494,900 |
| 2023 | $8,672 | $736,200 | $267,000 | $469,200 |
| 2022 | $6,963 | $672,100 | $236,700 | $435,400 |
| 2021 | $6,393 | $647,700 | $228,200 | $419,500 |
| 2020 | $6,744 | $633,800 | $228,200 | $405,600 |
| 2019 | $7,205 | $582,000 | $217,300 | $364,700 |
| 2018 | $7,087 | $514,300 | $189,400 | $324,900 |
| 2017 | $6,795 | $470,600 | $169,900 | $300,700 |
| 2016 | $6,112 | $423,000 | $151,700 | $271,300 |
| 2015 | $5,720 | $391,500 | $136,900 | $254,600 |
Source: Public Records
Map
Nearby Homes
- 55 Garland St
- 211 Elm St
- 62 Madison Ave
- 53 Sycamore St
- 138 Fremont Ave
- 114 Francis St
- 110 Ferry St
- 51 Adams Ave
- 12 Hamilton St Unit 8
- 101 Springvale Ave
- 15 Waverly Ave
- 859 Broadway Unit 15
- 37 Argyle St
- 121 Cottage St
- 44 Walnut St
- 881 Broadway Unit 28
- 238 Chelsea St
- 7 Ingleside Ave
- 181 Chelsea St
- 450 Vane St
Your Personal Tour Guide
Ask me questions while you tour the home.