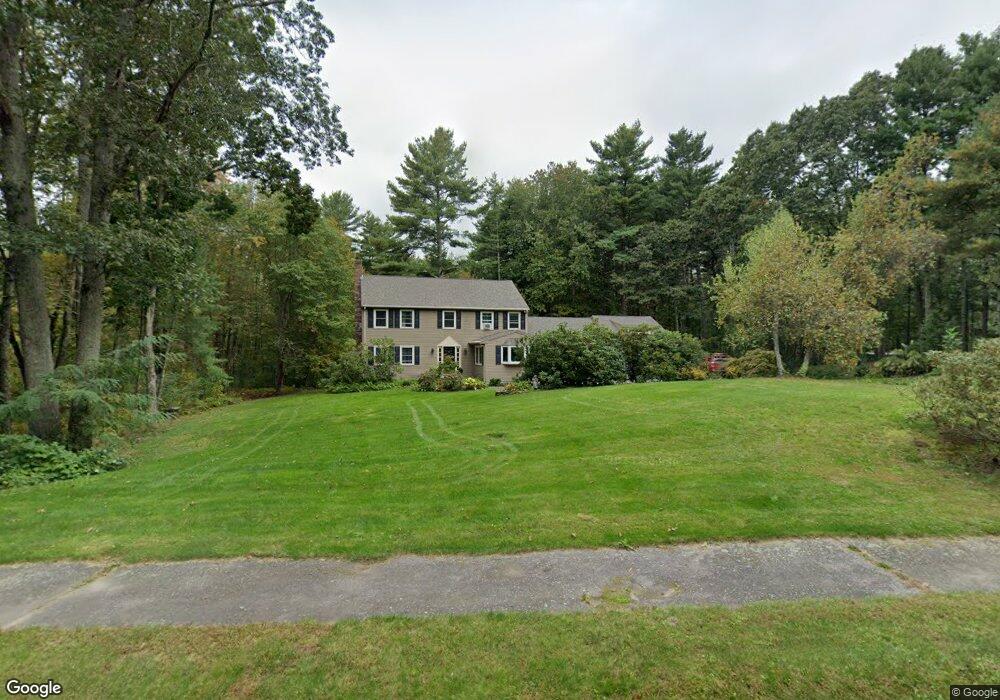
81 Fairway Ln Foxboro, MA 02035
Estimated Value: $914,000 - $966,000
4
Beds
3
Baths
2,590
Sq Ft
$365/Sq Ft
Est. Value
About This Home
This home is located at 81 Fairway Ln, Foxboro, MA 02035 and is currently estimated at $944,484, approximately $364 per square foot. 81 Fairway Ln is a home located in Norfolk County with nearby schools including Foxborough High School, Foxborough Regional Charter School, and Hands-On-Montessori School.
Ownership History
Date
Name
Owned For
Owner Type
Purchase Details
Closed on
Apr 26, 1990
Sold by
Walsh Joseph T
Bought by
Aravedon Eric S
Current Estimated Value
Home Financials for this Owner
Home Financials are based on the most recent Mortgage that was taken out on this home.
Original Mortgage
$160,000
Interest Rate
10.26%
Mortgage Type
Purchase Money Mortgage
Create a Home Valuation Report for This Property
The Home Valuation Report is an in-depth analysis detailing your home's value as well as a comparison with similar homes in the area
Home Values in the Area
Average Home Value in this Area
Purchase History
| Date | Buyer | Sale Price | Title Company |
|---|---|---|---|
| Aravedon Eric S | $270,000 | -- |
Source: Public Records
Mortgage History
| Date | Status | Borrower | Loan Amount |
|---|---|---|---|
| Open | Aravedon Eric S | $181,000 | |
| Closed | Aravedon Eric S | $145,000 | |
| Closed | Aravedon Eric S | $160,000 |
Source: Public Records
Tax History Compared to Growth
Tax History
| Year | Tax Paid | Tax Assessment Tax Assessment Total Assessment is a certain percentage of the fair market value that is determined by local assessors to be the total taxable value of land and additions on the property. | Land | Improvement |
|---|---|---|---|---|
| 2025 | $10,292 | $778,500 | $312,200 | $466,300 |
| 2024 | $9,976 | $738,400 | $311,200 | $427,200 |
| 2023 | $9,661 | $679,900 | $296,900 | $383,000 |
| 2022 | $8,933 | $615,200 | $244,500 | $370,700 |
| 2021 | $8,879 | $602,400 | $238,000 | $364,400 |
| 2020 | $8,601 | $590,300 | $238,000 | $352,300 |
| 2019 | $8,326 | $566,400 | $247,700 | $318,700 |
| 2018 | $8,126 | $557,700 | $247,700 | $310,000 |
| 2017 | $7,991 | $531,300 | $241,700 | $289,600 |
| 2016 | $7,603 | $513,000 | $213,700 | $299,300 |
| 2015 | $7,477 | $492,200 | $177,800 | $314,400 |
| 2014 | $7,216 | $481,400 | $173,100 | $308,300 |
Source: Public Records
Map
Nearby Homes
- 406 South St
- 80 Mill St
- 450 West St
- 356 Central St
- 12 Spring St
- 16 Treasure Island Rd
- 166 Chauncy St
- 24 Maverick Dr
- 11 W Belcher Rd Unit 2
- 4 Buckskin Dr
- 9 Oak Dr
- 231 Spring St
- 14 Baker St
- 28 Angell St
- 11 Orchard Place Unit 11
- 483 Thurston St
- 24 Mechanic St
- 42 Angell St
- 44 Angell St Unit 44
- 22 Pleasant St Unit C