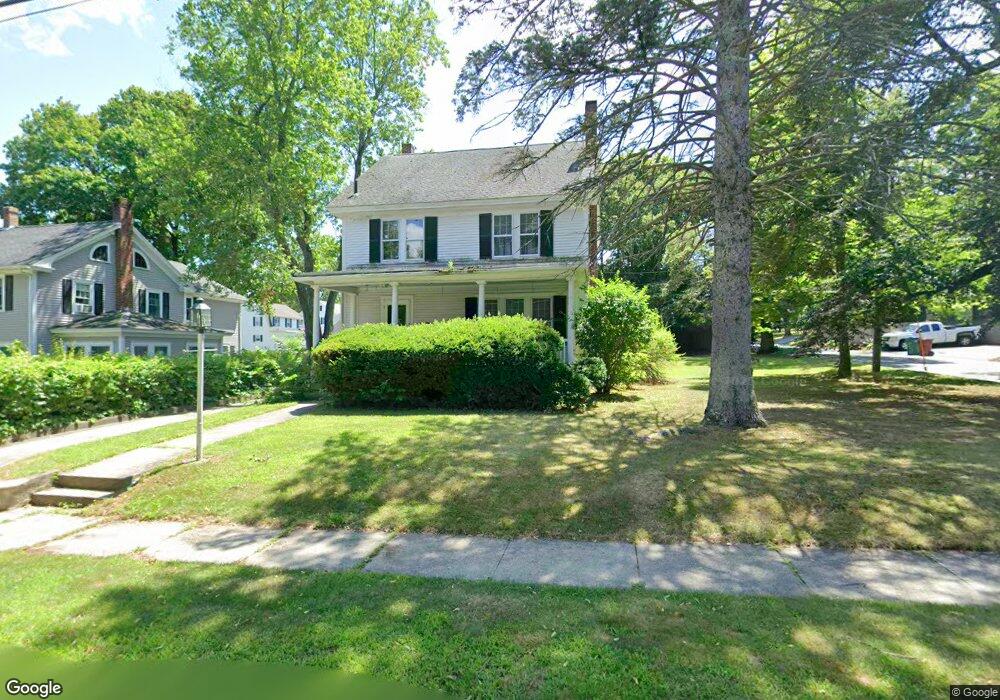
81 Glenwood St Lowell, MA 01852
Belvidere NeighborhoodEstimated Value: $609,518 - $667,000
3
Beds
2
Baths
1,849
Sq Ft
$347/Sq Ft
Est. Value
About This Home
This home is located at 81 Glenwood St, Lowell, MA 01852 and is currently estimated at $641,380, approximately $346 per square foot. 81 Glenwood St is a home located in Middlesex County with nearby schools including Moody Elementary School, Abraham Lincoln Elementary School, and Greenhalge Elementary School.
Ownership History
Date
Name
Owned For
Owner Type
Purchase Details
Closed on
Mar 11, 2020
Sold by
81 Glenwood Street Rt and Marquis
Bought by
Marquis Lisa M
Current Estimated Value
Purchase Details
Closed on
Jun 17, 1965
Bought by
Viau Richard P and Viau Virginia M
Create a Home Valuation Report for This Property
The Home Valuation Report is an in-depth analysis detailing your home's value as well as a comparison with similar homes in the area
Home Values in the Area
Average Home Value in this Area
Purchase History
| Date | Buyer | Sale Price | Title Company |
|---|---|---|---|
| Marquis Lisa M | -- | None Available | |
| Marquis Lisa M | -- | None Available | |
| Viau Richard P | $19,000 | -- |
Source: Public Records
Mortgage History
| Date | Status | Borrower | Loan Amount |
|---|---|---|---|
| Previous Owner | Viau Richard P | $50,000 |
Source: Public Records
Tax History Compared to Growth
Tax History
| Year | Tax Paid | Tax Assessment Tax Assessment Total Assessment is a certain percentage of the fair market value that is determined by local assessors to be the total taxable value of land and additions on the property. | Land | Improvement |
|---|---|---|---|---|
| 2025 | $6,095 | $530,900 | $246,200 | $284,700 |
| 2024 | $6,131 | $514,800 | $230,100 | $284,700 |
| 2023 | $5,752 | $463,100 | $200,100 | $263,000 |
| 2022 | $5,274 | $415,600 | $181,900 | $233,700 |
| 2021 | $4,921 | $365,600 | $158,200 | $207,400 |
| 2020 | $4,767 | $356,800 | $158,200 | $198,600 |
| 2019 | $4,911 | $349,800 | $157,300 | $192,500 |
| 2018 | $4,696 | $337,700 | $149,800 | $187,900 |
| 2017 | $4,673 | $313,200 | $139,000 | $174,200 |
| 2016 | $4,581 | $302,200 | $128,000 | $174,200 |
| 2015 | $4,399 | $284,200 | $128,000 | $156,200 |
| 2013 | $4,284 | $285,400 | $141,300 | $144,100 |
Source: Public Records
Map
Nearby Homes