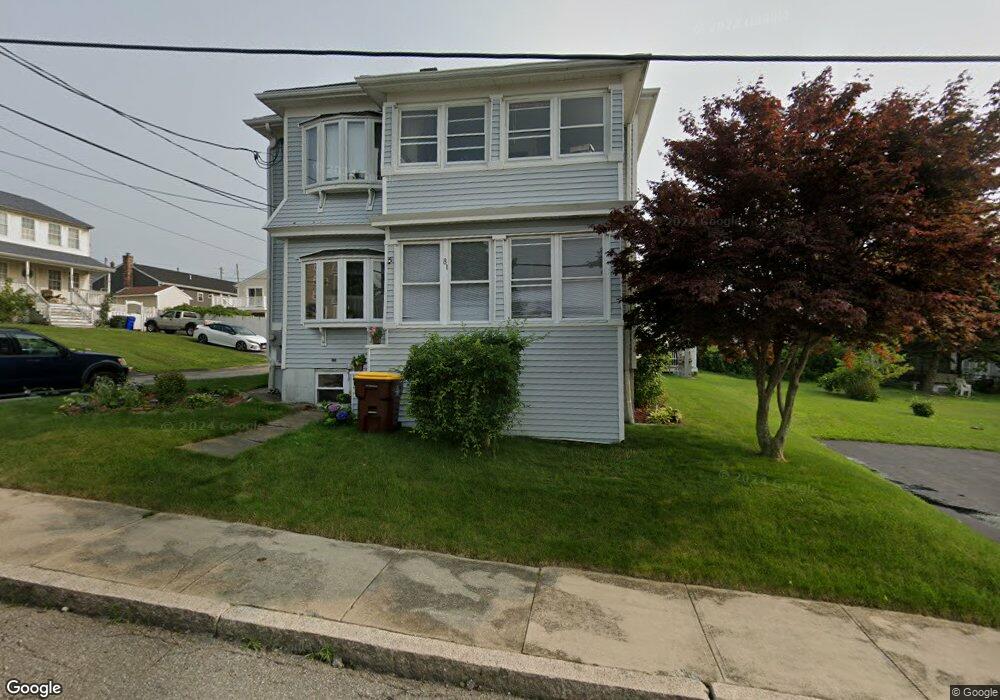
81 Last St Fall River, MA 02724
Sandy Beach NeighborhoodEstimated Value: $435,647 - $607,000
5
Beds
2
Baths
2,574
Sq Ft
$212/Sq Ft
Est. Value
About This Home
This home is located at 81 Last St, Fall River, MA 02724 and is currently estimated at $546,412, approximately $212 per square foot. 81 Last St is a home located in Bristol County with nearby schools including Henry Lord Community School, B M C Durfee High School, and Argosy Collegiate Charter School.
Ownership History
Date
Name
Owned For
Owner Type
Purchase Details
Closed on
Aug 17, 2023
Sold by
Tanguay Lisa
Bought by
Tanguay T T and Tanguay T
Current Estimated Value
Purchase Details
Closed on
Oct 3, 2011
Sold by
Tanguay Jeffrey D
Bought by
Tanguay Lisa
Purchase Details
Closed on
Jul 18, 2003
Sold by
Tanguay Lisa
Bought by
Tanguay Jeffrey D
Purchase Details
Closed on
Jul 8, 1997
Sold by
Macedo-Rackowski A A and Macedo-Rackowski Alma
Bought by
Tanguay Jeffrey D
Home Financials for this Owner
Home Financials are based on the most recent Mortgage that was taken out on this home.
Original Mortgage
$50,000
Interest Rate
7.86%
Mortgage Type
Purchase Money Mortgage
Create a Home Valuation Report for This Property
The Home Valuation Report is an in-depth analysis detailing your home's value as well as a comparison with similar homes in the area
Home Values in the Area
Average Home Value in this Area
Purchase History
| Date | Buyer | Sale Price | Title Company |
|---|---|---|---|
| Tanguay T T | -- | None Available | |
| Tanguay Lisa | -- | -- | |
| Tanguay Jeffrey D | -- | -- | |
| Tanguay Lisa | -- | -- | |
| Tanguay Jeffrey D | $31,000 | -- |
Source: Public Records
Mortgage History
| Date | Status | Borrower | Loan Amount |
|---|---|---|---|
| Previous Owner | Tanguay Jeffrey D | $50,000 | |
| Previous Owner | Tanguay Jeffrey D | $50,000 |
Source: Public Records
Tax History
| Year | Tax Paid | Tax Assessment Tax Assessment Total Assessment is a certain percentage of the fair market value that is determined by local assessors to be the total taxable value of land and additions on the property. | Land | Improvement |
|---|---|---|---|---|
| 2025 | $4,400 | $384,300 | $115,300 | $269,000 |
| 2024 | $4,064 | $353,700 | $113,000 | $240,700 |
| 2023 | $3,806 | $310,200 | $101,800 | $208,400 |
| 2022 | $3,730 | $295,600 | $96,100 | $199,500 |
| 2021 | $3,409 | $246,500 | $91,800 | $154,700 |
| 2020 | $3,081 | $213,200 | $87,600 | $125,600 |
| 2019 | $3,028 | $207,700 | $91,500 | $116,200 |
| 2018 | $3,563 | $195,900 | $92,200 | $103,700 |
| 2017 | $3,471 | $190,700 | $92,200 | $98,500 |
| 2016 | $2,607 | $191,300 | $95,000 | $96,300 |
| 2015 | $2,615 | $199,900 | $95,000 | $104,900 |
| 2014 | $2,620 | $208,300 | $95,000 | $113,300 |
Source: Public Records
Map
Nearby Homes
Your Personal Tour Guide
Ask me questions while you tour the home.