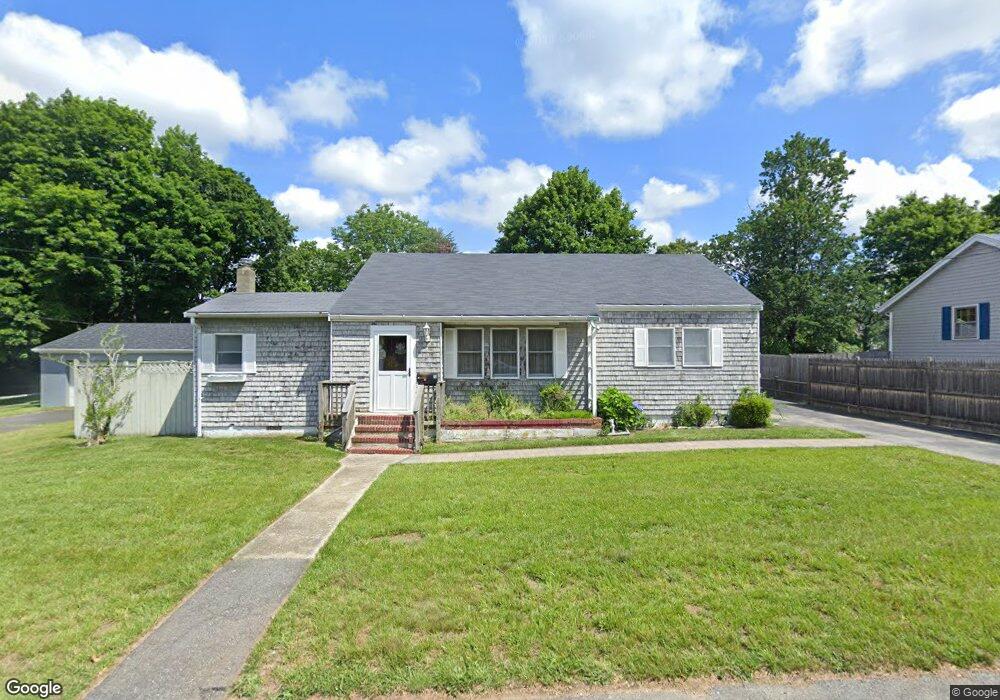
81 Lawson Ave Acushnet, MA 02743
North Fairhaven NeighborhoodEstimated Value: $331,000 - $405,866
3
Beds
1
Bath
1,150
Sq Ft
$321/Sq Ft
Est. Value
About This Home
This home is located at 81 Lawson Ave, Acushnet, MA 02743 and is currently estimated at $369,717, approximately $321 per square foot. 81 Lawson Ave is a home located in Bristol County with nearby schools including Acushnet Elementary School, Albert F Ford Middle School, and St Francis Xavier Elementary School.
Ownership History
Date
Name
Owned For
Owner Type
Purchase Details
Closed on
Mar 21, 2019
Sold by
Ayres Kim M
Bought by
Kim M Ayres Ret and Ayres
Current Estimated Value
Purchase Details
Closed on
Nov 2, 1994
Sold by
Buckley John R and Buckley Marguerite A
Bought by
Ayres Steven J and Ayres Kim M
Home Financials for this Owner
Home Financials are based on the most recent Mortgage that was taken out on this home.
Original Mortgage
$90,250
Interest Rate
8.71%
Mortgage Type
Purchase Money Mortgage
Create a Home Valuation Report for This Property
The Home Valuation Report is an in-depth analysis detailing your home's value as well as a comparison with similar homes in the area
Home Values in the Area
Average Home Value in this Area
Purchase History
| Date | Buyer | Sale Price | Title Company |
|---|---|---|---|
| Kim M Ayres Ret | -- | -- | |
| Ayres Steven J | $95,000 | -- |
Source: Public Records
Mortgage History
| Date | Status | Borrower | Loan Amount |
|---|---|---|---|
| Previous Owner | Ayres Steven J | $89,000 | |
| Previous Owner | Ayres Steven J | $90,000 | |
| Previous Owner | Ayres Steven J | $90,250 |
Source: Public Records
Tax History Compared to Growth
Tax History
| Year | Tax Paid | Tax Assessment Tax Assessment Total Assessment is a certain percentage of the fair market value that is determined by local assessors to be the total taxable value of land and additions on the property. | Land | Improvement |
|---|---|---|---|---|
| 2025 | $33 | $305,300 | $89,900 | $215,400 |
| 2024 | $3,250 | $284,800 | $85,700 | $199,100 |
| 2023 | $3,145 | $262,100 | $77,300 | $184,800 |
| 2022 | $3,124 | $235,400 | $73,200 | $162,200 |
| 2021 | $2,998 | $216,800 | $73,200 | $143,600 |
| 2020 | $3,022 | $216,800 | $73,200 | $143,600 |
| 2019 | $2,876 | $202,800 | $64,800 | $138,000 |
| 2018 | $3,407 | $191,800 | $64,800 | $127,000 |
| 2017 | $2,660 | $184,200 | $64,800 | $119,400 |
| 2016 | $2,620 | $180,300 | $64,800 | $115,500 |
| 2015 | $2,475 | $173,300 | $64,800 | $108,500 |
Source: Public Records
Map
Nearby Homes