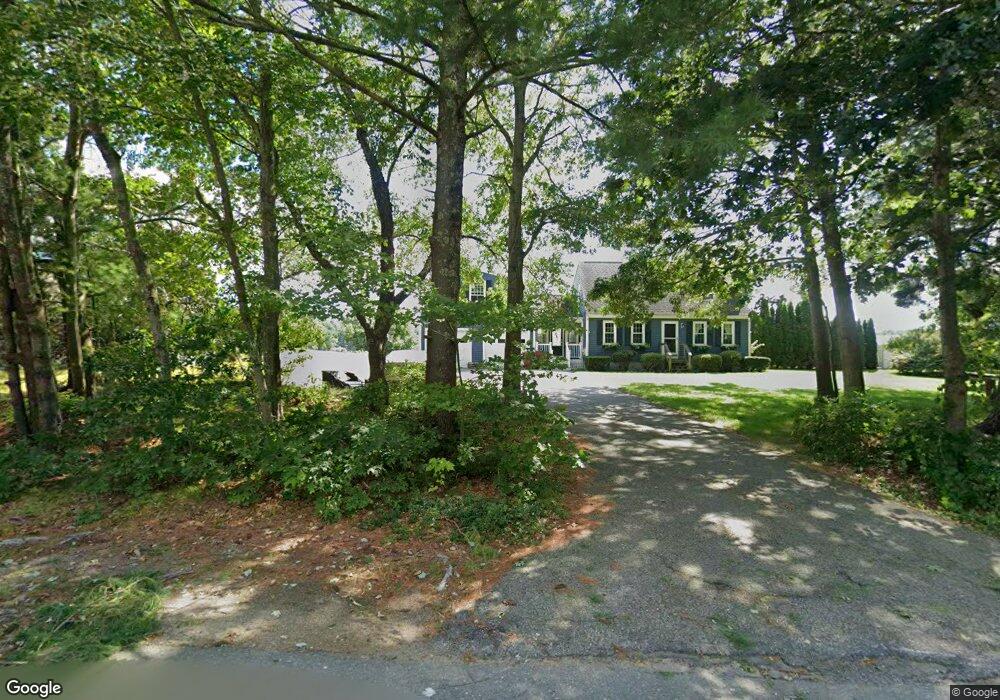
81 Maple Rd Middleboro, MA 02346
Estimated Value: $628,664 - $696,000
3
Beds
2
Baths
2,285
Sq Ft
$286/Sq Ft
Est. Value
About This Home
This home is located at 81 Maple Rd, Middleboro, MA 02346 and is currently estimated at $652,416, approximately $285 per square foot. 81 Maple Rd is a home located in Plymouth County with nearby schools including Mary K. Goode Elementary School and Chamberlain International School.
Ownership History
Date
Name
Owned For
Owner Type
Purchase Details
Closed on
Oct 27, 2000
Sold by
Kelleher Jeremiah T
Bought by
Schlack Jeffrey C and Schlack Christine L
Current Estimated Value
Purchase Details
Closed on
Jun 5, 1995
Sold by
Bisio Bldrs Inc
Bought by
Kelleher Jeremiah T and Kelleher Kathleen
Create a Home Valuation Report for This Property
The Home Valuation Report is an in-depth analysis detailing your home's value as well as a comparison with similar homes in the area
Home Values in the Area
Average Home Value in this Area
Purchase History
| Date | Buyer | Sale Price | Title Company |
|---|---|---|---|
| Schlack Jeffrey C | $186,500 | -- | |
| Kelleher Jeremiah T | $113,600 | -- |
Source: Public Records
Mortgage History
| Date | Status | Borrower | Loan Amount |
|---|---|---|---|
| Open | Kelleher Jeremiah T | $100,000 | |
| Open | Kelleher Jeremiah T | $170,000 | |
| Closed | Kelleher Jeremiah T | $17,000 |
Source: Public Records
Tax History
| Year | Tax Paid | Tax Assessment Tax Assessment Total Assessment is a certain percentage of the fair market value that is determined by local assessors to be the total taxable value of land and additions on the property. | Land | Improvement |
|---|---|---|---|---|
| 2025 | $7,585 | $565,600 | $164,200 | $401,400 |
| 2024 | $7,157 | $528,600 | $156,400 | $372,200 |
| 2023 | $6,874 | $482,700 | $156,400 | $326,300 |
| 2022 | $6,170 | $401,200 | $136,000 | $265,200 |
| 2021 | $6,176 | $379,600 | $119,200 | $260,400 |
| 2020 | $6,063 | $381,800 | $119,200 | $262,600 |
| 2019 | $5,468 | $353,200 | $119,200 | $234,000 |
| 2018 | $5,505 | $352,900 | $113,200 | $239,700 |
| 2017 | $5,185 | $328,800 | $109,000 | $219,800 |
| 2016 | $4,733 | $297,300 | $100,000 | $197,300 |
| 2015 | $4,611 | $292,200 | $99,500 | $192,700 |
Source: Public Records
Map
Nearby Homes
- 132 Everett St
- 80 Forest St
- 958 Centre St
- 246 Everett St
- 75 Oak St
- 87 Pearl St
- 28 School St
- 1 Bloomfield Ave
- 240 N Main St
- 0 Wareham Miller St Unit 73410845
- 6 Rock St
- 145 Wesley Cir
- 0 Murdock St Unit 73473837
- 18 Rock St
- 15 E Grove St
- 28 Haskell Cir
- 218 Old Center St
- 3 Old Field Way Unit 3
- 23 Taunton St
- 17 Cobblestone Ln
Your Personal Tour Guide
Ask me questions while you tour the home.