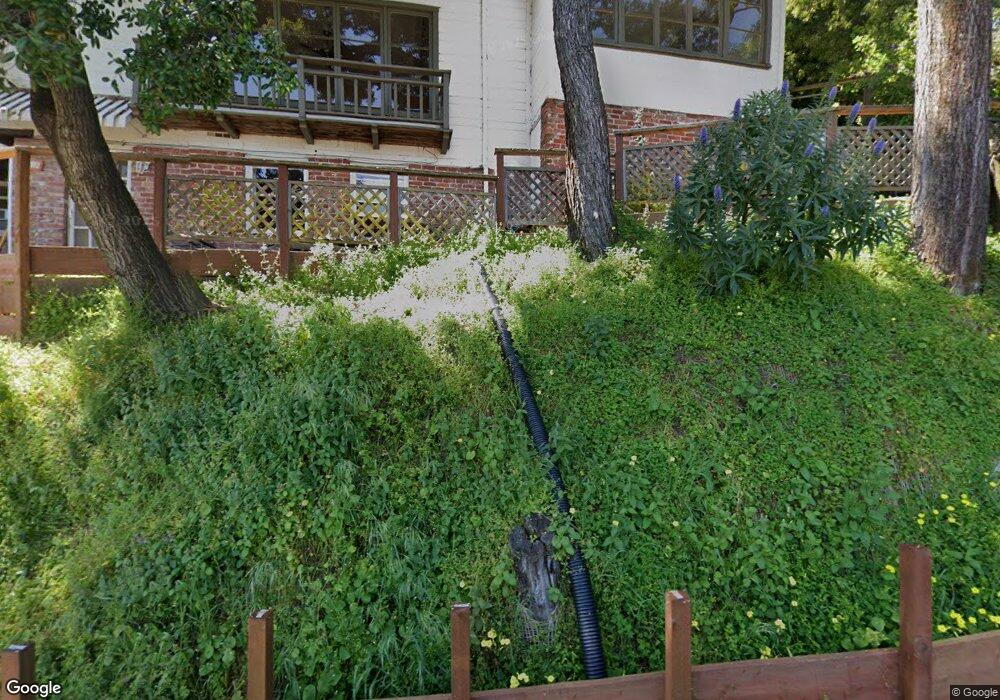
81 Martens Blvd San Rafael, CA 94901
Picnic Valley NeighborhoodEstimated Value: $1,092,000 - $1,178,386
2
Beds
2
Baths
1,116
Sq Ft
$1,021/Sq Ft
Est. Value
About This Home
This home is located at 81 Martens Blvd, San Rafael, CA 94901 and is currently estimated at $1,139,347, approximately $1,020 per square foot. 81 Martens Blvd is a home located in Marin County with nearby schools including Laurel Dell Elementary School, James B. Davidson Middle School, and San Rafael High School.
Ownership History
Date
Name
Owned For
Owner Type
Purchase Details
Closed on
Jan 2, 2020
Sold by
Medlin Bryan Paris and Navarrette Veronica June
Bought by
Medlin Bryan Paris and Navarrette Veronica June
Current Estimated Value
Purchase Details
Closed on
May 30, 2012
Sold by
Hunter Deborah
Bought by
Medlin Bryan and Navarrette Veronica
Home Financials for this Owner
Home Financials are based on the most recent Mortgage that was taken out on this home.
Original Mortgage
$387,600
Outstanding Balance
$267,863
Interest Rate
3.77%
Mortgage Type
New Conventional
Estimated Equity
$871,484
Purchase Details
Closed on
Jan 5, 2011
Sold by
Hunter John
Bought by
Hunter Deborah
Purchase Details
Closed on
Jun 2, 2010
Sold by
Hunter Deborah
Bought by
Hunter John
Purchase Details
Closed on
Mar 27, 2008
Sold by
Hunter Deborah
Bought by
Hunter Deborah
Home Financials for this Owner
Home Financials are based on the most recent Mortgage that was taken out on this home.
Original Mortgage
$193,000
Interest Rate
6.04%
Mortgage Type
New Conventional
Purchase Details
Closed on
Apr 12, 2006
Sold by
Peters Family Trust and Peters Beverly Ann
Bought by
Hunter Deborah
Create a Home Valuation Report for This Property
The Home Valuation Report is an in-depth analysis detailing your home's value as well as a comparison with similar homes in the area
Home Values in the Area
Average Home Value in this Area
Purchase History
| Date | Buyer | Sale Price | Title Company |
|---|---|---|---|
| Medlin Bryan Paris | -- | None Available | |
| Medlin Bryan | $484,500 | Fidelity National Title Co | |
| Hunter Deborah | -- | None Available | |
| Hunter John | -- | None Available | |
| Hunter Deborah | -- | Fidelity National Title Co | |
| Hunter Deborah | -- | None Available |
Source: Public Records
Mortgage History
| Date | Status | Borrower | Loan Amount |
|---|---|---|---|
| Open | Medlin Bryan | $387,600 | |
| Previous Owner | Hunter Deborah | $193,000 |
Source: Public Records
Tax History Compared to Growth
Tax History
| Year | Tax Paid | Tax Assessment Tax Assessment Total Assessment is a certain percentage of the fair market value that is determined by local assessors to be the total taxable value of land and additions on the property. | Land | Improvement |
|---|---|---|---|---|
| 2025 | $11,997 | $752,790 | $376,797 | $375,993 |
| 2024 | $11,997 | $738,033 | $369,411 | $368,622 |
| 2023 | $11,546 | $723,565 | $362,169 | $361,396 |
| 2022 | $10,981 | $709,378 | $355,068 | $354,310 |
| 2021 | $10,579 | $674,972 | $348,108 | $326,864 |
| 2020 | $9,038 | $551,265 | $344,541 | $206,724 |
| 2019 | $7,901 | $540,460 | $337,788 | $202,672 |
| 2018 | $7,835 | $529,867 | $331,167 | $198,700 |
| 2017 | $7,615 | $519,480 | $324,675 | $194,805 |
| 2016 | $7,353 | $509,294 | $318,309 | $190,985 |
| 2015 | $7,030 | $501,648 | $313,530 | $188,118 |
| 2014 | $6,731 | $491,822 | $307,389 | $184,433 |
Source: Public Records
Map
Nearby Homes
- 101 Martens Blvd
- 73 Martens Blvd
- 51 Martens Blvd
- 67 Martens Blvd
- 61 Martens Blvd
- 45 Martens Blvd
- 115 Martens Blvd
- 102 Martens Blvd
- 84 Martens Blvd
- 104 Martens Blvd
- 44 Martens Blvd
- 8 Alvina Ave
- 48 Martens Blvd
- 6 Alvina Ave
- 40 Martens Blvd
- 56 Martens Blvd Unit Down
- 56 Martens Blvd
- 41 Martens Blvd
- 12 Alvina Ave
- 70 Martens Blvd