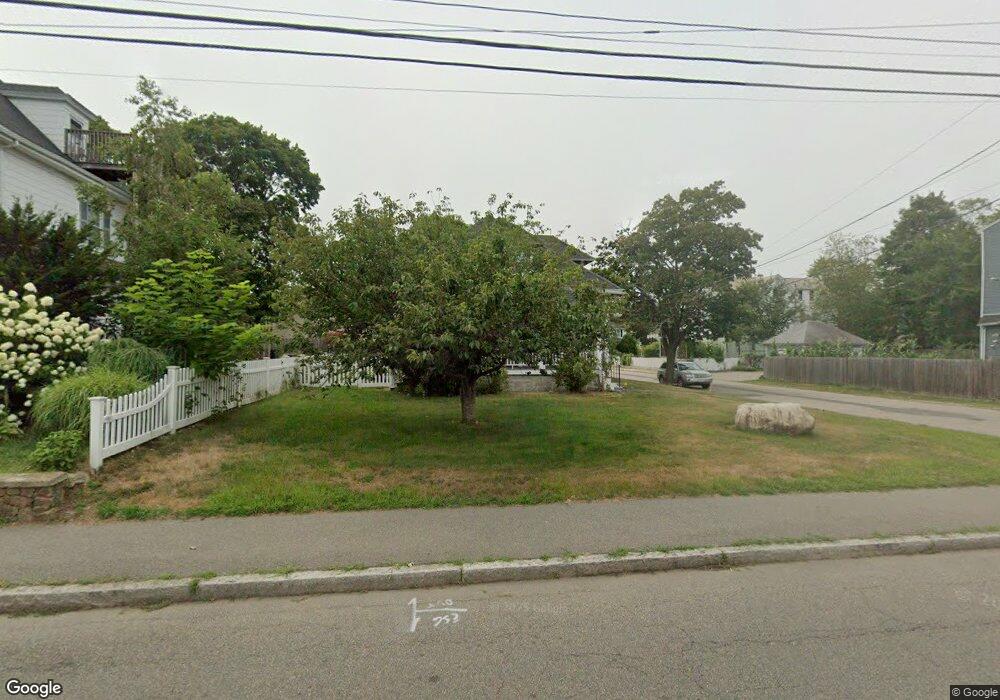
81 Moraine St Brockton, MA 02301
Estimated Value: $528,565 - $582,000
3
Beds
2
Baths
1,771
Sq Ft
$308/Sq Ft
Est. Value
About This Home
This home is located at 81 Moraine St, Brockton, MA 02301 and is currently estimated at $545,891, approximately $308 per square foot. 81 Moraine St is a home located in Plymouth County with nearby schools including Louis F Angelo Elementary School, Raymond K-8 Elementary School, and Hancock Elementary School.
Ownership History
Date
Name
Owned For
Owner Type
Purchase Details
Closed on
Apr 12, 2010
Sold by
Briarwood Constr Corp
Bought by
Clemens Robert A and Clemens Matilde R
Current Estimated Value
Home Financials for this Owner
Home Financials are based on the most recent Mortgage that was taken out on this home.
Original Mortgage
$245,471
Interest Rate
5.25%
Mortgage Type
FHA
Purchase Details
Closed on
Nov 12, 2009
Sold by
American Home Mtg Svcs
Bought by
Ferrone Raymond
Purchase Details
Closed on
May 21, 2009
Sold by
Cruse Jeffrey and Little Rosalyn
Bought by
Wells Fargo Bk
Purchase Details
Closed on
Nov 17, 2004
Sold by
Pardo Scott
Bought by
Little Rosalyn and Cruse Jeffrey
Purchase Details
Closed on
May 11, 1993
Sold by
Fnma
Bought by
Pardo Scott
Purchase Details
Closed on
Aug 28, 1992
Sold by
Paiva Edmund A
Bought by
Citicorp Mtg Inc
Purchase Details
Closed on
Sep 25, 1989
Sold by
Larkin Thomas F
Bought by
Paiva Edmund A
Create a Home Valuation Report for This Property
The Home Valuation Report is an in-depth analysis detailing your home's value as well as a comparison with similar homes in the area
Home Values in the Area
Average Home Value in this Area
Purchase History
| Date | Buyer | Sale Price | Title Company |
|---|---|---|---|
| Clemens Robert A | $250,000 | -- | |
| Briarwood Constr Corp | -- | -- | |
| Ferrone Raymond | -- | -- | |
| Ferrone Raymond | $120,495 | -- | |
| Wells Fargo Bk | $87,500 | -- | |
| Little Rosalyn | $280,000 | -- | |
| Pardo Scott | $75,000 | -- | |
| Citicorp Mtg Inc | $61,800 | -- | |
| Paiva Edmund A | $118,000 | -- |
Source: Public Records
Mortgage History
| Date | Status | Borrower | Loan Amount |
|---|---|---|---|
| Open | Paiva Edmund A | $243,410 | |
| Closed | Clemens Robert A | $245,471 | |
| Previous Owner | Paiva Edmund A | $224,000 |
Source: Public Records
Tax History Compared to Growth
Tax History
| Year | Tax Paid | Tax Assessment Tax Assessment Total Assessment is a certain percentage of the fair market value that is determined by local assessors to be the total taxable value of land and additions on the property. | Land | Improvement |
|---|---|---|---|---|
| 2025 | $5,473 | $451,900 | $140,000 | $311,900 |
| 2024 | $5,422 | $451,100 | $140,000 | $311,100 |
| 2023 | $5,479 | $422,100 | $104,200 | $317,900 |
| 2022 | $5,327 | $381,300 | $94,700 | $286,600 |
| 2021 | $4,759 | $328,200 | $78,600 | $249,600 |
| 2020 | $4,672 | $308,400 | $73,700 | $234,700 |
| 2019 | $4,555 | $293,100 | $71,900 | $221,200 |
| 2018 | $4,047 | $252,000 | $71,900 | $180,100 |
| 2017 | $3,751 | $233,000 | $71,900 | $161,100 |
| 2016 | $3,845 | $221,500 | $69,700 | $151,800 |
| 2015 | $3,703 | $204,000 | $69,700 | $134,300 |
| 2014 | $3,762 | $207,500 | $69,700 | $137,800 |
Source: Public Records
Map
Nearby Homes