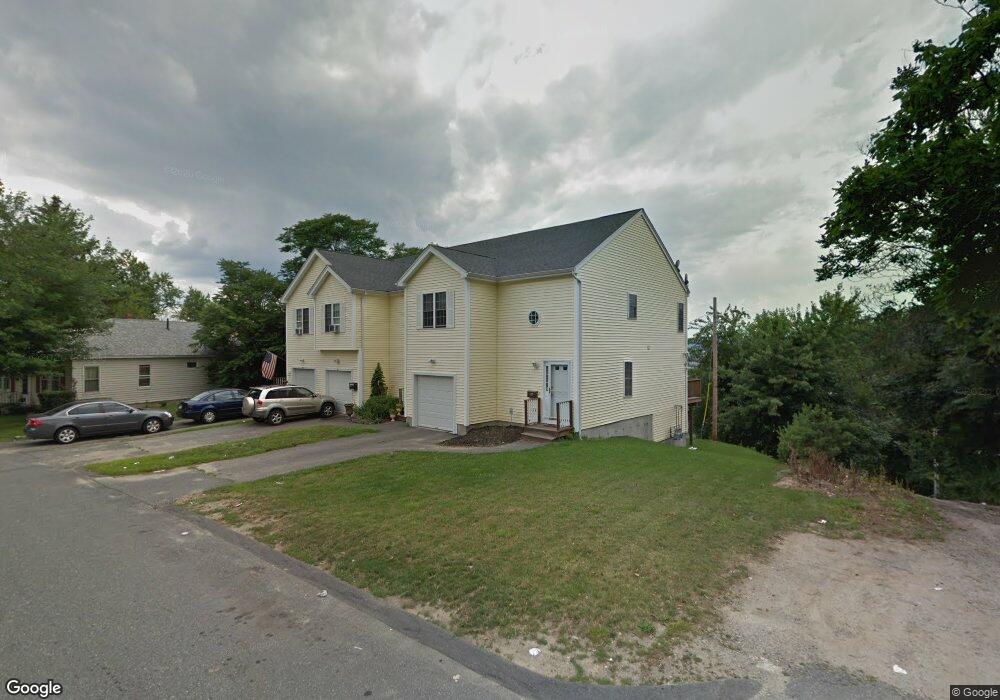
81 Orient St Worcester, MA 01604
Franklin Plantation NeighborhoodEstimated Value: $400,000 - $424,000
3
Beds
2
Baths
1,550
Sq Ft
$266/Sq Ft
Est. Value
About This Home
This home is located at 81 Orient St, Worcester, MA 01604 and is currently estimated at $411,870, approximately $265 per square foot. 81 Orient St is a home located in Worcester County with nearby schools including Jacob Hiatt Magnet School, Chandler Magnet, and Grafton Street.
Ownership History
Date
Name
Owned For
Owner Type
Purchase Details
Closed on
Jun 24, 2005
Sold by
85 Orient St T and Lippman Douglas
Bought by
Cunha Eliane N
Current Estimated Value
Home Financials for this Owner
Home Financials are based on the most recent Mortgage that was taken out on this home.
Original Mortgage
$192,800
Outstanding Balance
$101,042
Interest Rate
5.82%
Mortgage Type
Purchase Money Mortgage
Estimated Equity
$310,828
Create a Home Valuation Report for This Property
The Home Valuation Report is an in-depth analysis detailing your home's value as well as a comparison with similar homes in the area
Home Values in the Area
Average Home Value in this Area
Purchase History
| Date | Buyer | Sale Price | Title Company |
|---|---|---|---|
| Cunha Eliane N | $241,000 | -- |
Source: Public Records
Mortgage History
| Date | Status | Borrower | Loan Amount |
|---|---|---|---|
| Open | Cunha Eliane N | $192,800 |
Source: Public Records
Tax History Compared to Growth
Tax History
| Year | Tax Paid | Tax Assessment Tax Assessment Total Assessment is a certain percentage of the fair market value that is determined by local assessors to be the total taxable value of land and additions on the property. | Land | Improvement |
|---|---|---|---|---|
| 2025 | $4,482 | $339,800 | $59,300 | $280,500 |
| 2024 | $4,208 | $306,000 | $59,300 | $246,700 |
| 2023 | $4,050 | $282,400 | $51,500 | $230,900 |
| 2022 | $3,736 | $245,600 | $41,200 | $204,400 |
| 2021 | $3,665 | $225,100 | $33,000 | $192,100 |
| 2020 | $3,579 | $210,500 | $32,700 | $177,800 |
| 2019 | $3,429 | $190,500 | $28,600 | $161,900 |
| 2018 | $3,409 | $180,300 | $28,600 | $151,700 |
| 2017 | $3,198 | $166,400 | $28,600 | $137,800 |
| 2016 | $3,225 | $156,500 | $21,700 | $134,800 |
| 2015 | $3,141 | $156,500 | $21,700 | $134,800 |
| 2014 | $3,058 | $156,500 | $21,700 | $134,800 |
Source: Public Records
Map
Nearby Homes
- 3 Ingleside Ave
- 52 & 52.5 Wall St
- 27 Lyon St
- 93 Plantation St
- 19 Orient St
- 10 Almont Ave
- 64 Suffolk St
- 68 Dartmouth St
- 194 Norfolk St
- 167 Orient St
- 4 Fay St
- 135 Orient St
- 1 Envelope Terrace Unit 116
- 620 Franklin St
- 121 Pilgrim Ave
- 6 Berkeley St
- 13 Waite St
- 35 Houghton St
- 42 Ancona Rd
- 169 Fairmont Ave