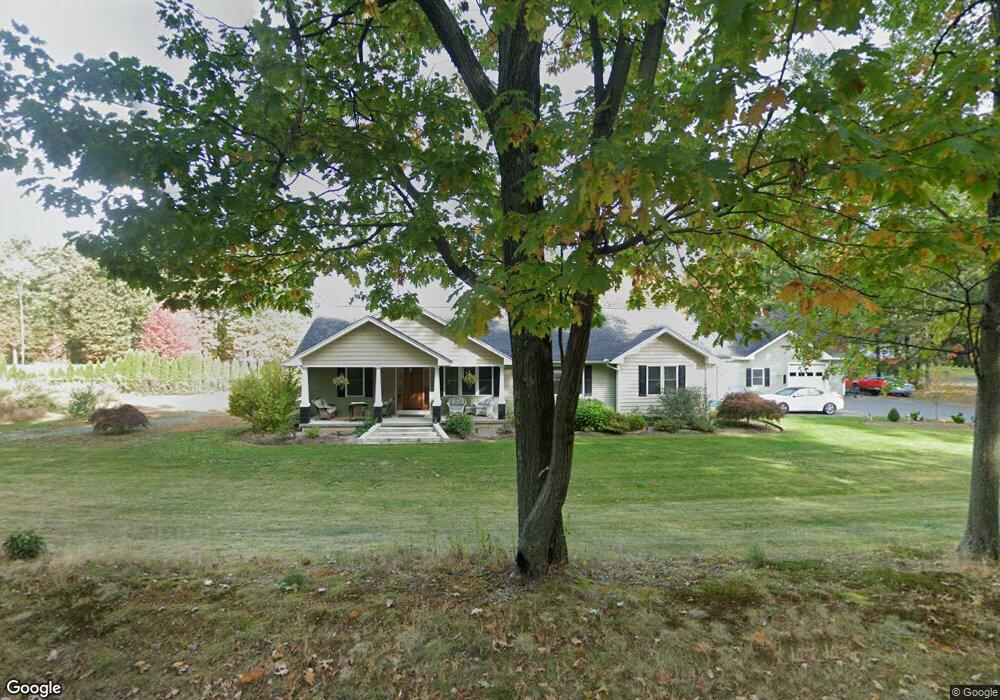
81 Phelps St Easthampton, MA 01027
Estimated Value: $455,000 - $594,000
3
Beds
3
Baths
1,590
Sq Ft
$331/Sq Ft
Est. Value
About This Home
This home is located at 81 Phelps St, Easthampton, MA 01027 and is currently estimated at $526,203, approximately $330 per square foot. 81 Phelps St is a home located in Hampshire County with nearby schools including Easthampton High School, Calvary Baptist Christian School, and Tri-County Schools.
Ownership History
Date
Name
Owned For
Owner Type
Purchase Details
Closed on
Jul 22, 2008
Sold by
Dushane Patricia A
Bought by
Foster Michael A and Dushane Patricia A
Current Estimated Value
Home Financials for this Owner
Home Financials are based on the most recent Mortgage that was taken out on this home.
Original Mortgage
$220,000
Outstanding Balance
$142,646
Interest Rate
6.17%
Mortgage Type
Purchase Money Mortgage
Estimated Equity
$383,557
Create a Home Valuation Report for This Property
The Home Valuation Report is an in-depth analysis detailing your home's value as well as a comparison with similar homes in the area
Home Values in the Area
Average Home Value in this Area
Purchase History
| Date | Buyer | Sale Price | Title Company |
|---|---|---|---|
| Foster Michael A | -- | -- |
Source: Public Records
Mortgage History
| Date | Status | Borrower | Loan Amount |
|---|---|---|---|
| Open | Foster Michael A | $220,000 |
Source: Public Records
Tax History Compared to Growth
Tax History
| Year | Tax Paid | Tax Assessment Tax Assessment Total Assessment is a certain percentage of the fair market value that is determined by local assessors to be the total taxable value of land and additions on the property. | Land | Improvement |
|---|---|---|---|---|
| 2025 | $6,962 | $509,300 | $134,600 | $374,700 |
| 2024 | $6,727 | $496,100 | $130,600 | $365,500 |
| 2023 | $5,312 | $362,600 | $103,600 | $259,000 |
| 2022 | $5,994 | $362,600 | $103,600 | $259,000 |
| 2021 | $6,919 | $374,700 | $103,600 | $271,100 |
| 2020 | $6,440 | $362,600 | $103,600 | $259,000 |
| 2019 | $5,382 | $348,100 | $103,600 | $244,500 |
| 2018 | $5,163 | $322,700 | $97,500 | $225,200 |
| 2017 | $5,051 | $311,600 | $93,700 | $217,900 |
| 2016 | $4,955 | $317,800 | $93,700 | $224,100 |
| 2015 | $4,815 | $317,800 | $93,700 | $224,100 |
Source: Public Records
Map
Nearby Homes