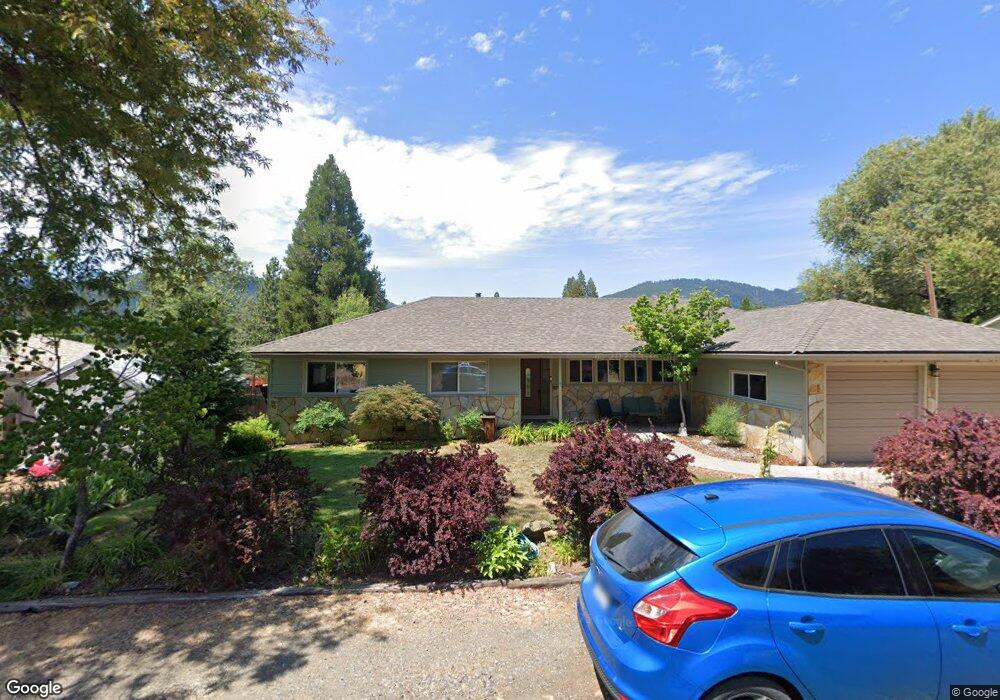
81 Pine St Weaverville, CA 96093
Estimated Value: $243,000 - $391,000
3
Beds
2
Baths
1,841
Sq Ft
$179/Sq Ft
Est. Value
About This Home
This home is located at 81 Pine St, Weaverville, CA 96093 and is currently estimated at $329,261, approximately $178 per square foot. 81 Pine St is a home with nearby schools including Weaverville Elementary School and Trinity High School.
Ownership History
Date
Name
Owned For
Owner Type
Purchase Details
Closed on
Dec 19, 2018
Sold by
Straatmann John Bradley and Straatmann Angela K
Bought by
Straatmann John B and Straatmann Angela K
Current Estimated Value
Purchase Details
Closed on
Jun 12, 2013
Sold by
Coen Norma K
Bought by
Straatmann John Bradley and Straatmann Angela K
Home Financials for this Owner
Home Financials are based on the most recent Mortgage that was taken out on this home.
Original Mortgage
$251,289
Outstanding Balance
$177,392
Interest Rate
3.32%
Mortgage Type
VA
Estimated Equity
$151,869
Create a Home Valuation Report for This Property
The Home Valuation Report is an in-depth analysis detailing your home's value as well as a comparison with similar homes in the area
Home Values in the Area
Average Home Value in this Area
Purchase History
| Date | Buyer | Sale Price | Title Company |
|---|---|---|---|
| Straatmann John B | -- | None Available | |
| Straatmann John Bradley | $246,000 | First American Title Company |
Source: Public Records
Mortgage History
| Date | Status | Borrower | Loan Amount |
|---|---|---|---|
| Open | Straatmann John Bradley | $251,289 |
Source: Public Records
Tax History
| Year | Tax Paid | Tax Assessment Tax Assessment Total Assessment is a certain percentage of the fair market value that is determined by local assessors to be the total taxable value of land and additions on the property. | Land | Improvement |
|---|---|---|---|---|
| 2025 | $3,076 | $302,919 | $44,325 | $258,594 |
| 2024 | $3,025 | $296,980 | $43,456 | $253,524 |
| 2023 | $3,025 | $291,157 | $42,604 | $248,553 |
| 2022 | $2,953 | $285,449 | $41,769 | $243,680 |
| 2021 | $2,903 | $279,852 | $40,950 | $238,902 |
| 2020 | $2,850 | $276,984 | $40,531 | $236,453 |
| 2019 | $2,795 | $271,554 | $39,737 | $231,817 |
| 2018 | $2,703 | $266,230 | $38,958 | $227,272 |
| 2017 | $2,695 | $261,011 | $38,195 | $222,816 |
| 2016 | $2,589 | $255,895 | $37,447 | $218,448 |
| 2015 | $2,548 | $252,052 | $36,885 | $215,167 |
| 2014 | $2,513 | $247,116 | $36,163 | $210,953 |
Source: Public Records
Map
Nearby Homes
- 41 Pine St
- 60 Mulligan St
- 30920 California 3
- 493 Main St
- 181 Barbara Ave
- 45 Horseshoe Ln
- 239 Barbara Ave
- 56 Horseshoe Ln
- 84 Ridge Rd
- 1081 Main St
- 160 Trinco Rd
- 125 Old Orchard
- 138 Sam Lee St
- 138 Sam Lee Dr
- 50,60,80 Masonic
- 51 & 75 Hart
- 230 Shasta Springs Rd
- 230 Shasta Springs
- 395 Masonic Ln
- 3791 Oregon St
Your Personal Tour Guide
Ask me questions while you tour the home.