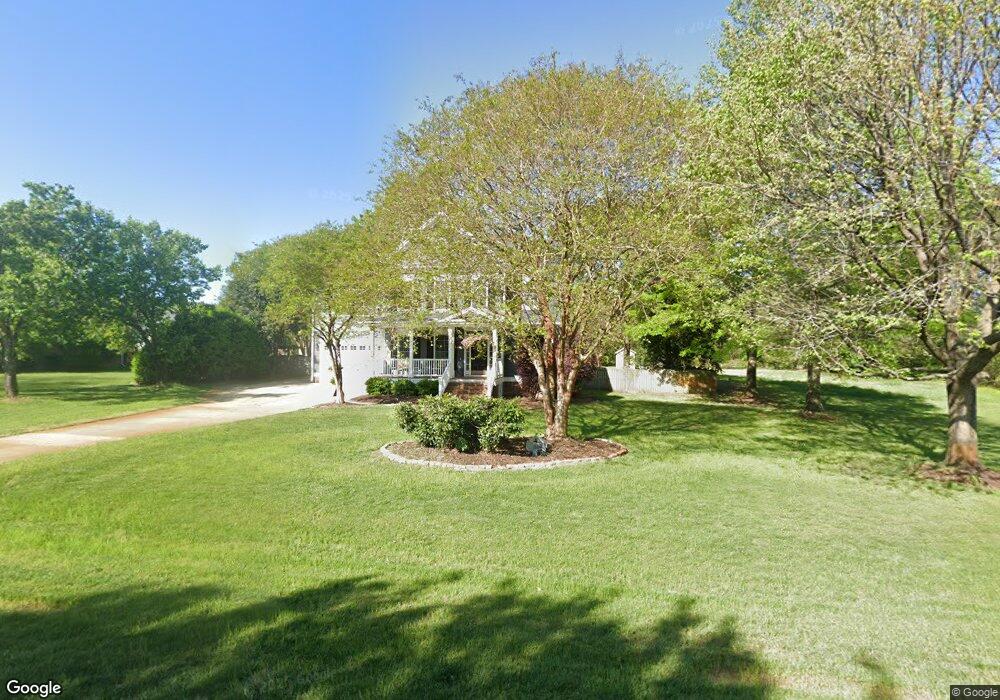
81 Rand Rd Raleigh, NC 27603
Estimated Value: $525,000 - $552,000
3
Beds
3
Baths
2,514
Sq Ft
$214/Sq Ft
Est. Value
About This Home
This home is located at 81 Rand Rd, Raleigh, NC 27603 and is currently estimated at $539,118, approximately $214 per square foot. 81 Rand Rd is a home located in Wake County with nearby schools including Rand Road Elementary, North Garner Middle, and South Garner High.
Ownership History
Date
Name
Owned For
Owner Type
Purchase Details
Closed on
Nov 8, 2018
Sold by
Brown Joseph M and Brown Pamela
Bought by
Rankie Luke and Rankie Caitlin
Current Estimated Value
Home Financials for this Owner
Home Financials are based on the most recent Mortgage that was taken out on this home.
Original Mortgage
$308,650
Outstanding Balance
$270,841
Interest Rate
4.7%
Mortgage Type
New Conventional
Estimated Equity
$268,277
Purchase Details
Closed on
Dec 20, 2002
Sold by
Seneca Homes Inc
Bought by
Brown Joseph M and Brown Pamela
Home Financials for this Owner
Home Financials are based on the most recent Mortgage that was taken out on this home.
Original Mortgage
$199,920
Interest Rate
6.07%
Purchase Details
Closed on
Feb 1, 2002
Sold by
Perry Development Co Llc
Bought by
Seneca Homes Inc
Create a Home Valuation Report for This Property
The Home Valuation Report is an in-depth analysis detailing your home's value as well as a comparison with similar homes in the area
Home Values in the Area
Average Home Value in this Area
Purchase History
| Date | Buyer | Sale Price | Title Company |
|---|---|---|---|
| Rankie Luke | $325,000 | None Available | |
| Brown Joseph M | $250,000 | -- | |
| Seneca Homes Inc | $70,000 | -- |
Source: Public Records
Mortgage History
| Date | Status | Borrower | Loan Amount |
|---|---|---|---|
| Open | Rankie Luke | $308,650 | |
| Previous Owner | Brown Joseph M | $199,920 | |
| Closed | Brown Joseph M | $49,980 |
Source: Public Records
Tax History
| Year | Tax Paid | Tax Assessment Tax Assessment Total Assessment is a certain percentage of the fair market value that is determined by local assessors to be the total taxable value of land and additions on the property. | Land | Improvement |
|---|---|---|---|---|
| 2025 | $3,271 | $508,246 | $95,000 | $413,246 |
| 2024 | $3,176 | $508,246 | $95,000 | $413,246 |
Source: Public Records
Map
Nearby Homes
- 8421 Crowder Rd
- 8309 Ashwood Dr
- 10853 Old Stage Rd
- 9908 Huntwyck Dr
- 125 River Pearl St
- 1109 Stone Home Lot 3 Ln
- 1109 Stone Home Lot 2 Ln
- 5009 Trotter Dr
- 100 Rocca Cir
- 8529 Hurst Dr
- 348 Seastone St
- 1124 Armsleigh Ct
- 1409 Porchlight Ct
- 2600 Banks Rd Unit Lot 2
- 2608 Banks Rd Unit Lot 1
- 450 Seastone St
- 5428 Overdale Ln
- 9002 Old Stage Rd
- 169 Montesino Dr
- 901 Edgewater Dr
- 1100 Pasture View Ln
- 77 Rand Rd
- 1104 Pasture View Ln
- 1024 Pasture View Ln
- 89 Rand Rd
- 1108 Pasture View Ln
- 1101 Pasture View Ln
- 1020 Pasture View Ln
- 94 Rand Rd
- 93 Rand Rd
- 1109 Pasture View Ln
- 4409 Deer Knoll Ct
- 4505 Deer Stream Ln
- 4405 Deer Knoll Ct
- 4501 Deer Stream Ln
- 98 Rand Rd
- 1016 Pasture View Ln
- 4401 Deer Knoll Ct
- 95 Rand Rd
- 1113 Pasture View Ln
Your Personal Tour Guide
Ask me questions while you tour the home.