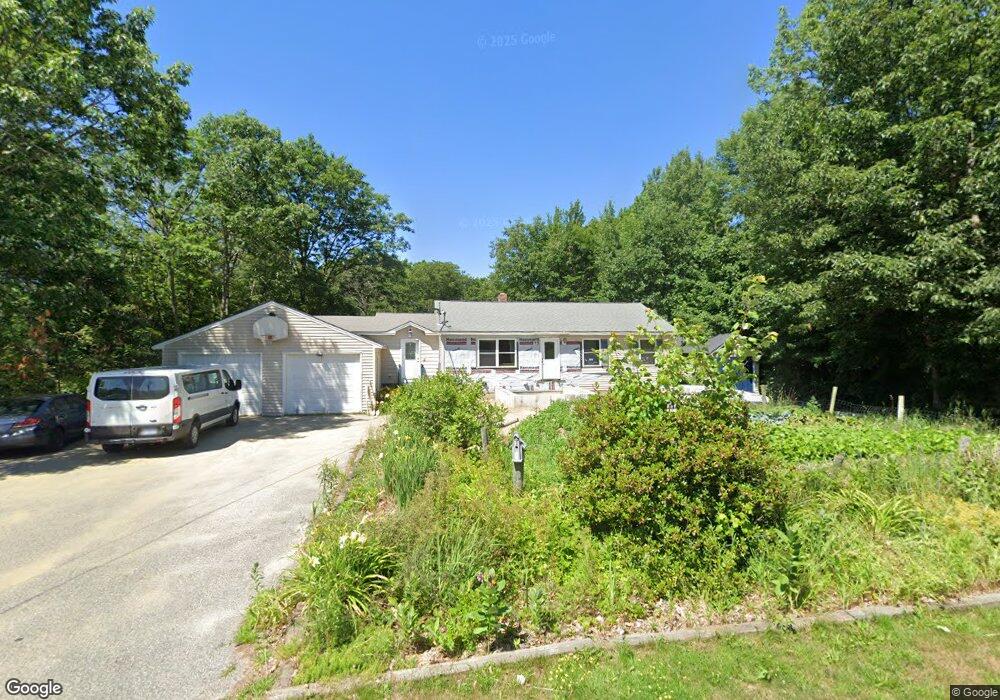
81 Spring St Sabattus, ME 04280
Estimated Value: $371,000 - $504,000
3
Beds
2
Baths
2,112
Sq Ft
$213/Sq Ft
Est. Value
About This Home
This home is located at 81 Spring St, Sabattus, ME 04280 and is currently estimated at $449,401, approximately $212 per square foot. 81 Spring St is a home with nearby schools including Carrie Ricker School, Oak Hill Middle School, and Oak Hill High School.
Ownership History
Date
Name
Owned For
Owner Type
Purchase Details
Closed on
Nov 9, 2015
Sold by
Mcrae Margaret A
Bought by
Mcrae Michael J and Morin Susan T
Current Estimated Value
Home Financials for this Owner
Home Financials are based on the most recent Mortgage that was taken out on this home.
Original Mortgage
$14,628
Outstanding Balance
$11,382
Interest Rate
3.88%
Mortgage Type
New Conventional
Estimated Equity
$438,019
Purchase Details
Closed on
Jul 8, 2008
Sold by
Hasbro Excavation Contr
Bought by
Castonguay Justin and Castonguay Angela
Home Financials for this Owner
Home Financials are based on the most recent Mortgage that was taken out on this home.
Original Mortgage
$30,960
Interest Rate
6.01%
Mortgage Type
FHA
Create a Home Valuation Report for This Property
The Home Valuation Report is an in-depth analysis detailing your home's value as well as a comparison with similar homes in the area
Home Values in the Area
Average Home Value in this Area
Purchase History
| Date | Buyer | Sale Price | Title Company |
|---|---|---|---|
| Mcrae Michael J | -- | -- | |
| Castonguay Justin | -- | -- |
Source: Public Records
Mortgage History
| Date | Status | Borrower | Loan Amount |
|---|---|---|---|
| Open | Mcrae Michael J | $14,628 | |
| Closed | Castonguay Justin | $30,960 |
Source: Public Records
Tax History
| Year | Tax Paid | Tax Assessment Tax Assessment Total Assessment is a certain percentage of the fair market value that is determined by local assessors to be the total taxable value of land and additions on the property. | Land | Improvement |
|---|---|---|---|---|
| 2024 | $5,556 | $290,900 | $31,400 | $259,500 |
| 2023 | $5,309 | $290,900 | $31,400 | $259,500 |
| 2022 | $4,843 | $290,900 | $31,400 | $259,500 |
| 2021 | $4,567 | $290,900 | $31,400 | $259,500 |
| 2020 | $4,833 | $272,300 | $31,400 | $240,900 |
| 2019 | $4,432 | $249,700 | $31,400 | $218,300 |
| 2018 | $4,432 | $249,700 | $31,400 | $218,300 |
| 2017 | $4,432 | $249,700 | $31,400 | $218,300 |
| 2016 | $4,682 | $249,700 | $31,400 | $218,300 |
| 2014 | $4,445 | $249,700 | $31,400 | $218,300 |
| 2013 | $4,083 | $249,700 | $31,400 | $218,300 |
Source: Public Records
Map
Nearby Homes
Your Personal Tour Guide
Ask me questions while you tour the home.