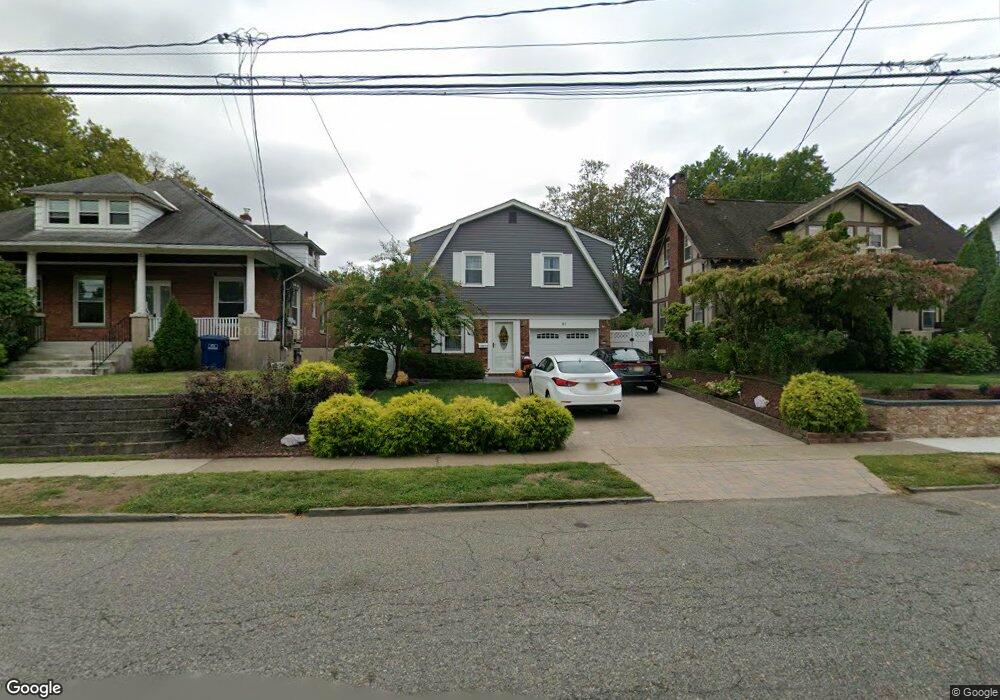
81 Spring Valley Ave Hackensack, NJ 07601
Estimated Value: $712,775 - $816,000
4
Beds
2
Baths
2,062
Sq Ft
$370/Sq Ft
Est. Value
About This Home
This home is located at 81 Spring Valley Ave, Hackensack, NJ 07601 and is currently estimated at $763,694, approximately $370 per square foot. 81 Spring Valley Ave is a home located in Bergen County with nearby schools including Hackensack High School, Bergen County Christian Academy, and Ben Porat Yosef.
Ownership History
Date
Name
Owned For
Owner Type
Purchase Details
Closed on
Feb 26, 2021
Sold by
Valencia Hector
Bought by
Valencia Maria
Current Estimated Value
Purchase Details
Closed on
Sep 21, 2000
Bought by
Campbell Claude A
Home Financials for this Owner
Home Financials are based on the most recent Mortgage that was taken out on this home.
Original Mortgage
$47,350
Interest Rate
7.81%
Purchase Details
Closed on
Sep 11, 1998
Sold by
Goedeke Willy G and Goedeke Karin
Bought by
Campbell Claude A and Campbell Donna C
Home Financials for this Owner
Home Financials are based on the most recent Mortgage that was taken out on this home.
Original Mortgage
$171,000
Interest Rate
6.89%
Create a Home Valuation Report for This Property
The Home Valuation Report is an in-depth analysis detailing your home's value as well as a comparison with similar homes in the area
Home Values in the Area
Average Home Value in this Area
Purchase History
| Date | Buyer | Sale Price | Title Company |
|---|---|---|---|
| Valencia Maria | -- | None Listed On Document | |
| Valencia Maria | -- | None Listed On Document | |
| Campbell Claude A | -- | -- | |
| Campbell Claude A | -- | -- | |
| Campbell Claude A | $190,000 | -- |
Source: Public Records
Mortgage History
| Date | Status | Borrower | Loan Amount |
|---|---|---|---|
| Previous Owner | Campbell Claude A | $47,350 | |
| Previous Owner | Campbell Claude A | $171,000 |
Source: Public Records
Tax History
| Year | Tax Paid | Tax Assessment Tax Assessment Total Assessment is a certain percentage of the fair market value that is determined by local assessors to be the total taxable value of land and additions on the property. | Land | Improvement |
|---|---|---|---|---|
| 2025 | $13,755 | $450,100 | $199,300 | $250,800 |
| 2024 | $12,958 | $450,100 | $199,300 | $250,800 |
| 2023 | $12,760 | $450,100 | $199,300 | $250,800 |
| 2022 | $12,760 | $455,400 | $192,000 | $263,400 |
| 2021 | $13,405 | $399,200 | $161,000 | $238,200 |
| 2020 | $13,210 | $399,200 | $161,000 | $238,200 |
| 2019 | $13,213 | $393,600 | $158,500 | $235,100 |
| 2018 | $13,263 | $388,600 | $155,000 | $233,600 |
| 2017 | $10,709 | $313,600 | $152,500 | $161,100 |
| 2016 | $10,026 | $296,800 | $137,500 | $159,300 |
| 2015 | $9,391 | $268,300 | $147,000 | $121,300 |
| 2014 | $8,913 | $268,300 | $147,000 | $121,300 |
Source: Public Records
Map
Nearby Homes
- 67 Spring Valley Ave
- 120 Louis St
- 95 Cedar Ave
- 29 Martin Terrace
- 32 Martin Terrace
- 75 Pine St
- 207 Elm Ave
- 258 Ross Ave
- 81 Fairmount Ave
- 30 Willow Ave
- 150 Grand Ave Unit 1A
- 15 Zabriskie St Unit 1505
- 290 Clinton Place
- 31 Fairmount Ave Unit 16A
- 31 Fairmount Ave
- 258 Clinton Place
- 149 Allen St
- 25 Jefferson St Unit 3D
- 262 Spring Valley Ave
- 16 Jefferson St
- 75 Spring Valley Ave
- 85 Spring Valley Ave
- 105 Krone Place
- 89 Spring Valley Ave
- 91 Spring Valley Ave
- 82 Spring Valley Ave
- 128 Elm Ave
- 130 Elm Ave
- 124 Elm Ave
- 104 Herman St Unit 6
- 86 Spring Valley Ave
- 63 Spring Valley Ave
- 95 Spring Valley Ave
- 136 Elm Ave
- 90 Spring Valley Ave
- 70 Spring Valley Ave
- 140 Elm Ave
- 94 Spring Valley Ave
- 116 Elm Ave
- 129 Krone Place
Your Personal Tour Guide
Ask me questions while you tour the home.