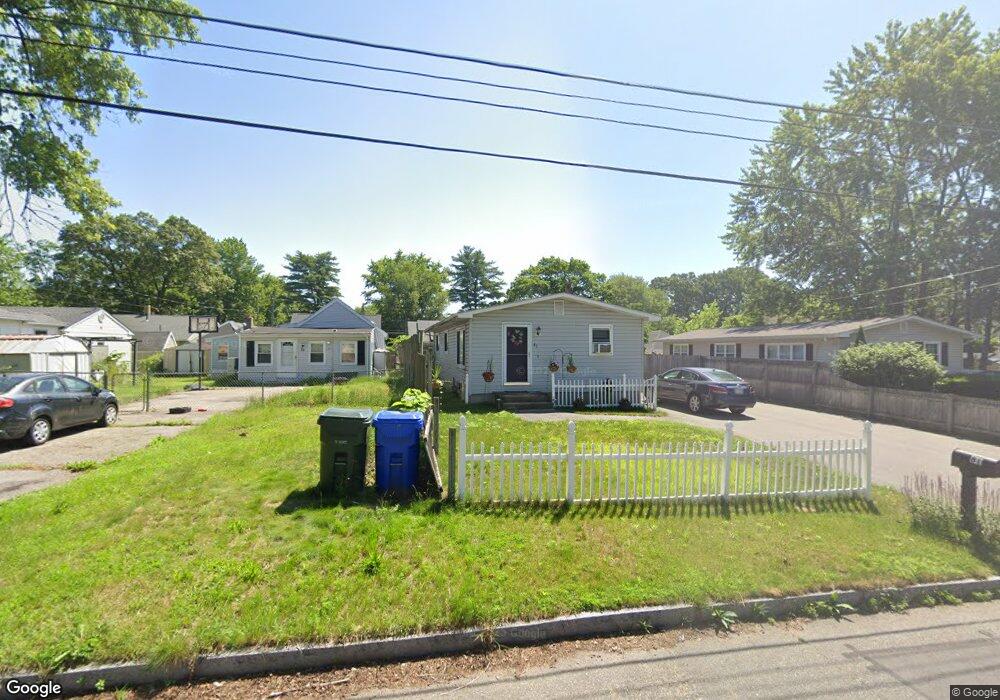
81 Wrentham Rd Springfield, MA 01119
Boston Road NeighborhoodEstimated Value: $257,226 - $285,000
3
Beds
1
Bath
840
Sq Ft
$320/Sq Ft
Est. Value
About This Home
This home is located at 81 Wrentham Rd, Springfield, MA 01119 and is currently estimated at $269,057, approximately $320 per square foot. 81 Wrentham Rd is a home located in Hampden County with nearby schools including Warner, M Marcus Kiley Middle, and Springfield Central High School.
Ownership History
Date
Name
Owned For
Owner Type
Purchase Details
Closed on
Apr 25, 2016
Sold by
Boland Nancy and Boland Carolyn M
Bought by
Boland Carolyn M and Soto-Boland Nicholas
Current Estimated Value
Create a Home Valuation Report for This Property
The Home Valuation Report is an in-depth analysis detailing your home's value as well as a comparison with similar homes in the area
Home Values in the Area
Average Home Value in this Area
Purchase History
| Date | Buyer | Sale Price | Title Company |
|---|---|---|---|
| Boland Carolyn M | -- | -- |
Source: Public Records
Tax History Compared to Growth
Tax History
| Year | Tax Paid | Tax Assessment Tax Assessment Total Assessment is a certain percentage of the fair market value that is determined by local assessors to be the total taxable value of land and additions on the property. | Land | Improvement |
|---|---|---|---|---|
| 2025 | $3,034 | $193,500 | $43,000 | $150,500 |
| 2024 | $2,976 | $185,300 | $40,200 | $145,100 |
| 2023 | $2,767 | $162,300 | $38,300 | $124,000 |
| 2022 | $2,646 | $140,600 | $38,300 | $102,300 |
| 2021 | $2,657 | $140,600 | $34,800 | $105,800 |
| 2020 | $2,681 | $137,300 | $34,800 | $102,500 |
| 2019 | $2,218 | $112,700 | $34,800 | $77,900 |
| 2018 | $2,316 | $117,700 | $34,800 | $82,900 |
| 2017 | $2,194 | $111,600 | $34,800 | $76,800 |
| 2016 | $2,084 | $106,000 | $34,800 | $71,200 |
| 2015 | $2,093 | $106,400 | $34,800 | $71,600 |
Source: Public Records
Map
Nearby Homes
- 30 Jerilis Dr
- 25 Pioneer Way
- 32 Better Way
- 665 Parker St
- 34 Temby St
- 44 Rest Way
- 193 Marmon St
- 89 Pine Grove St
- 97-99 Pine Grove St
- 98 Pine Grove St
- 70 Shumway St Unit 29
- 70 Shumway St Unit A1
- 20 Wrenwood St
- 61 Glenmore St
- 74 Blanche St
- 161 Fernbank Rd
- 401 Grayson Dr
- 0 Michon St
- 200 Slater Ave
- 140 Cardinal St