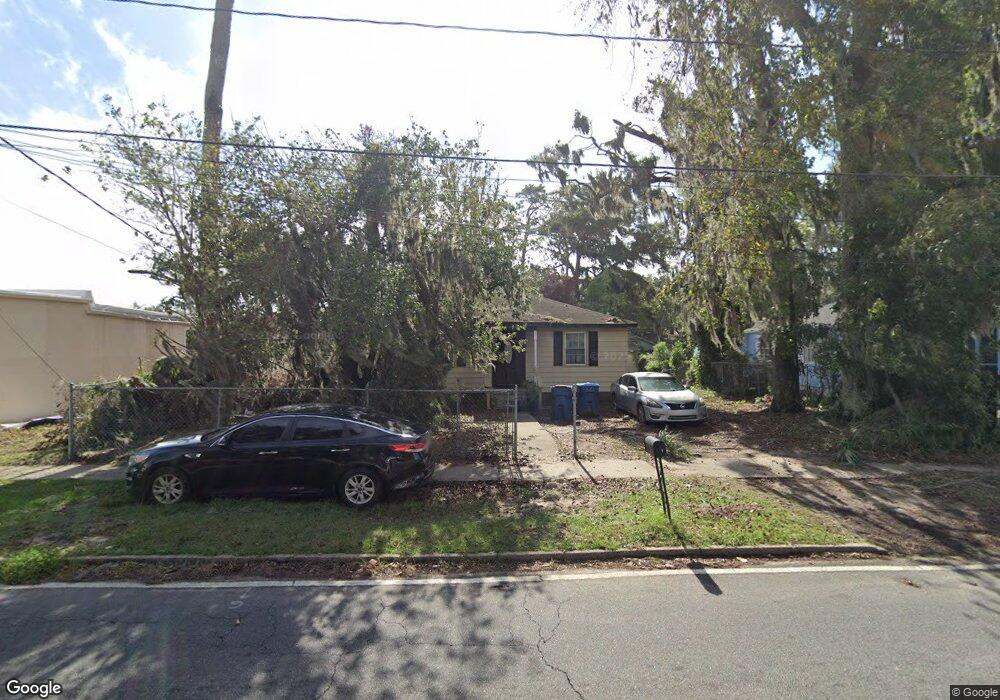
810 1st St Brunswick, GA 31520
Estimated Value: $124,000 - $201,000
3
Beds
2
Baths
1,391
Sq Ft
$109/Sq Ft
Est. Value
About This Home
This home is located at 810 1st St, Brunswick, GA 31520 and is currently estimated at $152,269, approximately $109 per square foot. 810 1st St is a home located in Glynn County with nearby schools including Goodyear Elementary School, Risley Middle School, and Glynn Academy.
Ownership History
Date
Name
Owned For
Owner Type
Purchase Details
Closed on
Apr 9, 2018
Sold by
Marion
Bought by
Marion Norma J
Current Estimated Value
Purchase Details
Closed on
Feb 22, 2010
Sold by
Frederica Credit Union
Bought by
Marion Isia
Home Financials for this Owner
Home Financials are based on the most recent Mortgage that was taken out on this home.
Original Mortgage
$51,000
Interest Rate
7%
Mortgage Type
Adjustable Rate Mortgage/ARM
Purchase Details
Closed on
Oct 6, 2009
Sold by
Peart Orville
Bought by
Frederica Credit Union
Create a Home Valuation Report for This Property
The Home Valuation Report is an in-depth analysis detailing your home's value as well as a comparison with similar homes in the area
Purchase History
| Date | Buyer | Sale Price | Title Company |
|---|---|---|---|
| Marion Norma J | -- | -- | |
| Marion Isia | $30,000 | -- | |
| Frederica Credit Union | -- | -- |
Source: Public Records
Mortgage History
| Date | Status | Borrower | Loan Amount |
|---|---|---|---|
| Previous Owner | Marion Isia | $51,000 |
Source: Public Records
Tax History
| Year | Tax Paid | Tax Assessment Tax Assessment Total Assessment is a certain percentage of the fair market value that is determined by local assessors to be the total taxable value of land and additions on the property. | Land | Improvement |
|---|---|---|---|---|
| 2025 | $953 | $45,320 | $3,440 | $41,880 |
| 2024 | $721 | $34,280 | $3,440 | $30,840 |
| 2023 | $1,250 | $26,120 | $3,440 | $22,680 |
| 2022 | $1,254 | $26,120 | $3,440 | $22,680 |
| 2021 | $946 | $17,880 | $3,440 | $14,440 |
| 2020 | $954 | $17,880 | $3,440 | $14,440 |
| 2019 | $323 | $14,560 | $3,440 | $11,120 |
| 2018 | $435 | $18,120 | $3,440 | $14,680 |
| 2017 | $932 | $18,120 | $3,440 | $14,680 |
| 2016 | $722 | $15,000 | $3,440 | $11,560 |
| 2015 | $745 | $15,000 | $3,440 | $11,560 |
| 2014 | $745 | $15,000 | $3,440 | $11,560 |
Source: Public Records
Map
Nearby Homes