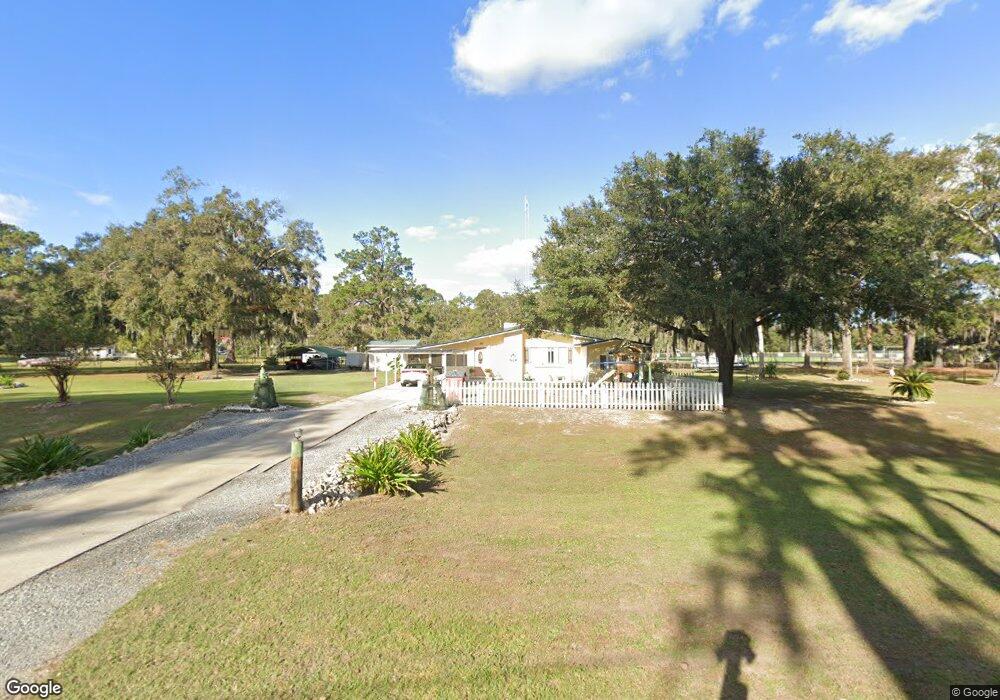
810 Adams St Darien, GA 31305
Estimated Value: $334,000 - $483,000
3
Beds
2
Baths
1,531
Sq Ft
$264/Sq Ft
Est. Value
About This Home
This home is located at 810 Adams St, Darien, GA 31305 and is currently estimated at $403,513, approximately $263 per square foot. 810 Adams St is a home with nearby schools including Todd Grant Elementary School, McIntosh County Middle School, and McIntosh County Academy.
Ownership History
Date
Name
Owned For
Owner Type
Purchase Details
Closed on
Aug 28, 2019
Sold by
Mixon Kimberly G
Bought by
Mixon Kimberly G and Mixon Bryan H
Current Estimated Value
Home Financials for this Owner
Home Financials are based on the most recent Mortgage that was taken out on this home.
Original Mortgage
$130,077
Outstanding Balance
$83,493
Interest Rate
3.7%
Mortgage Type
New Conventional
Estimated Equity
$320,020
Purchase Details
Closed on
Oct 17, 2003
Sold by
Mixon Bryan Heath
Bought by
Mixon Kimberly G
Purchase Details
Closed on
Jan 12, 1999
Sold by
Sallerson Sharon J
Bought by
Mixon Bryan Heather
Purchase Details
Closed on
Nov 10, 1998
Sold by
Wideman Ricky
Bought by
Sallerson Sharon
Purchase Details
Closed on
Mar 27, 1998
Sold by
Sallerson Sharon
Bought by
Allen Thomas
Purchase Details
Closed on
Apr 8, 1993
Bought by
Allen Clifford N
Create a Home Valuation Report for This Property
The Home Valuation Report is an in-depth analysis detailing your home's value as well as a comparison with similar homes in the area
Home Values in the Area
Average Home Value in this Area
Purchase History
| Date | Buyer | Sale Price | Title Company |
|---|---|---|---|
| Mixon Kimberly G | -- | -- | |
| Mixon Kimberly G | -- | -- | |
| Mixon Bryan Heather | $58,500 | -- | |
| Sallerson Sharon | -- | -- | |
| Allen Thomas | $29,500 | -- | |
| Sallerson Sharon | -- | -- | |
| Allen Clifford N | -- | -- |
Source: Public Records
Mortgage History
| Date | Status | Borrower | Loan Amount |
|---|---|---|---|
| Open | Mixon Kimberly G | $130,077 |
Source: Public Records
Tax History Compared to Growth
Tax History
| Year | Tax Paid | Tax Assessment Tax Assessment Total Assessment is a certain percentage of the fair market value that is determined by local assessors to be the total taxable value of land and additions on the property. | Land | Improvement |
|---|---|---|---|---|
| 2024 | $2,004 | $158,384 | $80,360 | $78,024 |
| 2023 | $2,010 | $156,164 | $80,360 | $75,804 |
| 2022 | $1,603 | $106,908 | $43,600 | $63,308 |
| 2021 | $1,603 | $90,604 | $43,600 | $47,004 |
| 2020 | $1,620 | $89,268 | $43,600 | $45,668 |
| 2019 | $1,435 | $84,404 | $39,720 | $44,684 |
| 2018 | $2,564 | $84,404 | $39,720 | $44,684 |
| 2017 | $2,187 | $73,164 | $31,760 | $41,404 |
| 2016 | $1,435 | $73,164 | $31,760 | $41,404 |
| 2015 | $1,408 | $52,840 | $16,200 | $36,640 |
| 2014 | $1,411 | $58,290 | $19,800 | $38,490 |
Source: Public Records
Map
Nearby Homes
- 800 Wayne St
- 505 Madison St
- 410 Munro St
- 1103 E Broad St
- Lot 5 Black
- LOT 28 Black Island Rd
- 1006 Oglethorpe Ln
- 1001 Poppell Dr
- 227 Fort King George Dr Unit K
- 227 Fort King George Dr Unit G
- Tract B 38 Acres
- 0 Georgia 99 Unit 1648162
- 0 Georgia 99 Unit 1647831
- Lot 4 Fort King George
- Lot 3 Fort King George
- 10 Garrison St
- 1106 Alabama St
- None Jackson St
- 801 Jackson St
- 91 Screven St Unit Bldg D Unit 309