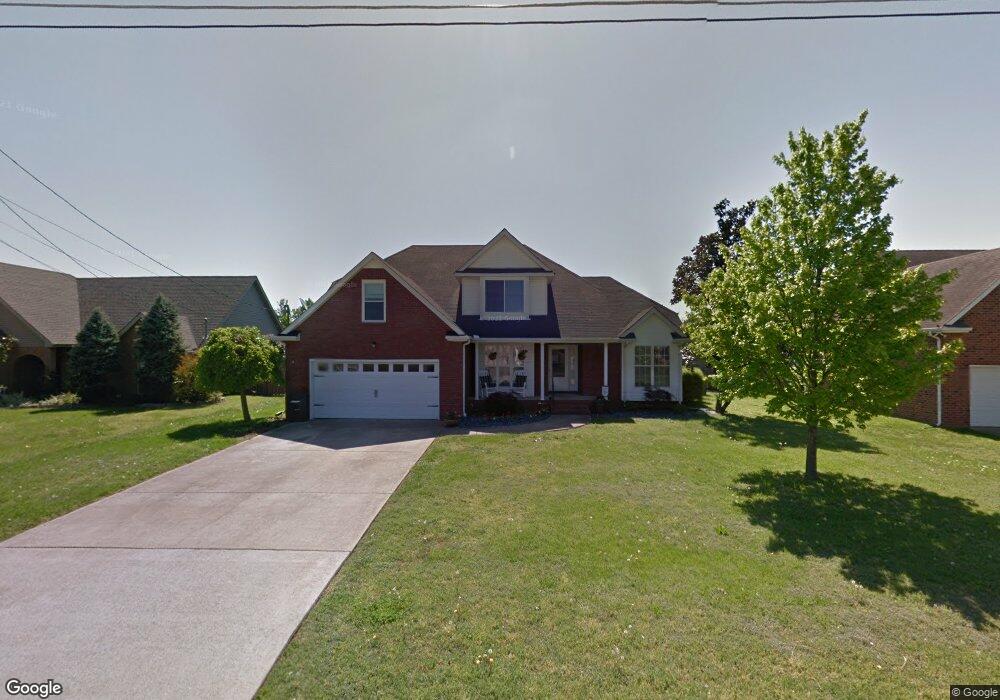
810 Balleycastle Dr Smyrna, TN 37167
Estimated Value: $444,000 - $521,000
--
Bed
4
Baths
2,408
Sq Ft
$198/Sq Ft
Est. Value
About This Home
This home is located at 810 Balleycastle Dr, Smyrna, TN 37167 and is currently estimated at $476,937, approximately $198 per square foot. 810 Balleycastle Dr is a home located in Rutherford County with nearby schools including Rocky Fork Elementary School, Rocky Fork Middle School, and Smyrna High School.
Ownership History
Date
Name
Owned For
Owner Type
Purchase Details
Closed on
Feb 28, 2013
Sold by
Chunn Nathanael L
Bought by
Hall Michael S Jennifer K
Current Estimated Value
Home Financials for this Owner
Home Financials are based on the most recent Mortgage that was taken out on this home.
Original Mortgage
$177,460
Outstanding Balance
$125,342
Interest Rate
3.56%
Mortgage Type
Commercial
Estimated Equity
$351,595
Purchase Details
Closed on
Dec 22, 2010
Sold by
Scarlett Jon
Bought by
Chunn Nathanael L
Home Financials for this Owner
Home Financials are based on the most recent Mortgage that was taken out on this home.
Original Mortgage
$192,006
Interest Rate
4.4%
Purchase Details
Closed on
Apr 14, 1999
Sold by
Richard Dukes Construction
Bought by
Hartley Clayton W
Home Financials for this Owner
Home Financials are based on the most recent Mortgage that was taken out on this home.
Original Mortgage
$172,000
Interest Rate
7.08%
Create a Home Valuation Report for This Property
The Home Valuation Report is an in-depth analysis detailing your home's value as well as a comparison with similar homes in the area
Home Values in the Area
Average Home Value in this Area
Purchase History
| Date | Buyer | Sale Price | Title Company |
|---|---|---|---|
| Hall Michael S Jennifer K | $187,000 | -- | |
| Chunn Nathanael L | $197,000 | -- | |
| Hartley Clayton W | $182,900 | -- | |
| Richard Dukes Homes | -- | -- |
Source: Public Records
Mortgage History
| Date | Status | Borrower | Loan Amount |
|---|---|---|---|
| Open | Hall Michael S Jennifer K | $177,460 | |
| Previous Owner | Chunn Nathanael L | $192,006 | |
| Previous Owner | Richard Dukes Homes | $172,000 |
Source: Public Records
Tax History Compared to Growth
Tax History
| Year | Tax Paid | Tax Assessment Tax Assessment Total Assessment is a certain percentage of the fair market value that is determined by local assessors to be the total taxable value of land and additions on the property. | Land | Improvement |
|---|---|---|---|---|
| 2025 | $2,523 | $105,075 | $13,750 | $91,325 |
| 2024 | $2,523 | $105,075 | $13,750 | $91,325 |
| 2023 | $2,313 | $96,325 | $13,750 | $82,575 |
| 2022 | $2,063 | $96,325 | $13,750 | $82,575 |
| 2021 | $1,950 | $66,775 | $10,000 | $56,775 |
| 2020 | $1,950 | $66,775 | $10,000 | $56,775 |
| 2019 | $1,950 | $66,775 | $10,000 | $56,775 |
| 2018 | $1,870 | $66,775 | $0 | $0 |
| 2017 | $1,838 | $51,575 | $0 | $0 |
| 2016 | $1,838 | $51,575 | $0 | $0 |
| 2015 | $1,838 | $51,575 | $0 | $0 |
| 2014 | $1,283 | $51,575 | $0 | $0 |
| 2013 | -- | $53,675 | $0 | $0 |
Source: Public Records
Map
Nearby Homes
- 647 Legacy Dr
- 0 Old Nashville Hwy Unit RTC2943706
- 305 Wildwood Dr
- 1034 Leadville Dr
- 1026 Rosemont Terrace
- 4074 Utica St
- 1014 Rosemont Terrace
- 2028 Caladonia Way
- 3039 Burnt Pine Dr
- 1036 Harold Lee Dr
- 3057 Burnt Pine Dr
- 2064 Caladonia Way
- 809 Stewart Valley Dr
- 148 Tedder Blvd
- 109 Longfellow Ln
- 607 General Barksdale Dr
- 101 Longfellow Ln
- 203 Longfellow Ln
- 2090 Caladonia Way
- 107 Longfellow Ln
- 808 Balleycastle Dr
- 812 Balleycastle Dr
- 909 Turlough Ct
- 911 Turlough Ct
- 806 Balleycastle Dr
- 814 Balleycastle Dr
- 907 Turlough Ct
- 813 Balleycastle Dr
- 913 Turlough Ct
- 815 Balleycastle Dr
- 811 Balleycastle Dr
- 905 Turlough Ct
- 817 Balleycastle Dr
- 804 Balleycastle Dr
- 816 Balleycastle Dr
- 809 Balleycastle Dr
- 915 Turlough Ct
- 903 Turlough Ct
- 819 Balleycastle Dr
- 906 Turlough Ct