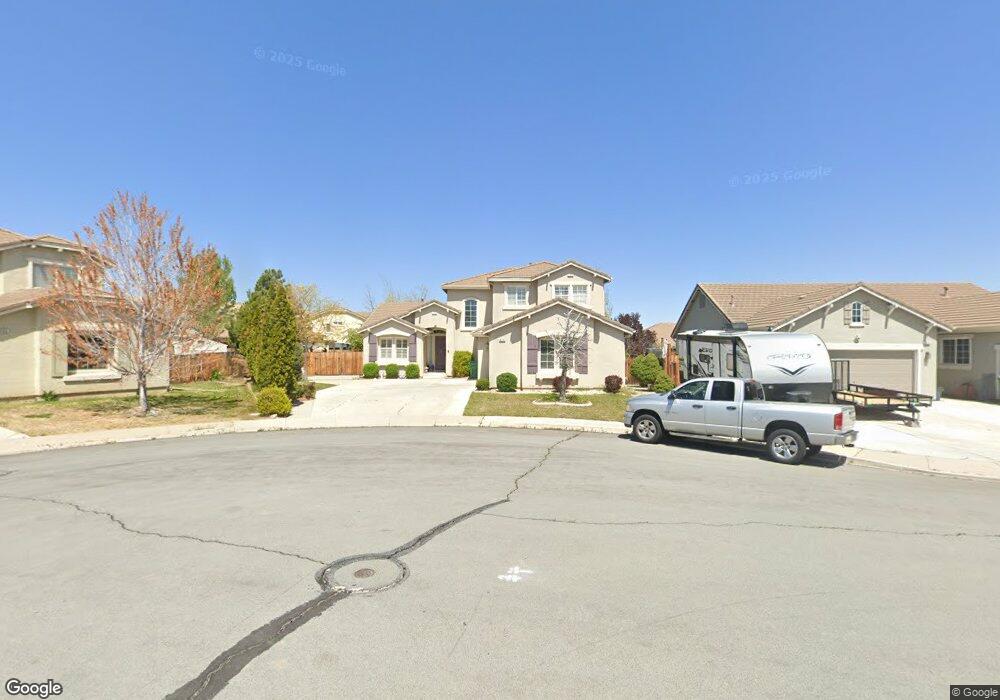
810 Baxter Pass Ct Unit 5 Sparks, NV 89436
Sparks Galleria NeighborhoodEstimated Value: $675,000 - $690,000
4
Beds
3
Baths
2,813
Sq Ft
$242/Sq Ft
Est. Value
About This Home
This home is located at 810 Baxter Pass Ct Unit 5, Sparks, NV 89436 and is currently estimated at $681,644, approximately $242 per square foot. 810 Baxter Pass Ct Unit 5 is a home located in Washoe County with nearby schools including Miguel Sepulveda Elementary School, Sky Ranch Middle School, and Edward C Reed High School.
Ownership History
Date
Name
Owned For
Owner Type
Purchase Details
Closed on
Nov 15, 2010
Sold by
Ho Loc B
Bought by
Ho Loc B and Lam Lan D
Current Estimated Value
Home Financials for this Owner
Home Financials are based on the most recent Mortgage that was taken out on this home.
Original Mortgage
$100,000
Outstanding Balance
$1,495
Interest Rate
4.23%
Mortgage Type
New Conventional
Estimated Equity
$680,149
Purchase Details
Closed on
Jan 14, 2005
Sold by
Lam Lan Duc
Bought by
Ho Loc B
Home Financials for this Owner
Home Financials are based on the most recent Mortgage that was taken out on this home.
Original Mortgage
$248,503
Interest Rate
5.8%
Mortgage Type
Unknown
Create a Home Valuation Report for This Property
The Home Valuation Report is an in-depth analysis detailing your home's value as well as a comparison with similar homes in the area
Home Values in the Area
Average Home Value in this Area
Purchase History
| Date | Buyer | Sale Price | Title Company |
|---|---|---|---|
| Ho Loc B | -- | Ticor Title Reno | |
| Ho Loc B | -- | First American Title | |
| Ho Loc B | $311,000 | First American Title |
Source: Public Records
Mortgage History
| Date | Status | Borrower | Loan Amount |
|---|---|---|---|
| Open | Ho Loc B | $100,000 | |
| Closed | Ho Loc B | $248,503 |
Source: Public Records
Tax History Compared to Growth
Tax History
| Year | Tax Paid | Tax Assessment Tax Assessment Total Assessment is a certain percentage of the fair market value that is determined by local assessors to be the total taxable value of land and additions on the property. | Land | Improvement |
|---|---|---|---|---|
| 2025 | $3,547 | $173,923 | $38,465 | $135,458 |
| 2024 | $3,547 | $170,020 | $33,950 | $136,070 |
| 2023 | $2,579 | $167,240 | $38,780 | $128,460 |
| 2022 | $3,346 | $136,107 | $29,155 | $106,952 |
| 2021 | $3,249 | $131,394 | $25,025 | $106,369 |
| 2020 | $3,153 | $131,084 | $24,675 | $106,409 |
| 2019 | $3,061 | $126,448 | $23,940 | $102,508 |
| 2018 | $2,972 | $118,330 | $18,270 | $100,060 |
| 2017 | $2,887 | $117,830 | $17,710 | $100,120 |
| 2016 | $2,808 | $115,490 | $15,505 | $99,985 |
| 2015 | $2,803 | $113,072 | $13,545 | $99,527 |
| 2014 | $2,722 | $98,867 | $12,740 | $86,127 |
| 2013 | -- | $72,877 | $9,415 | $63,462 |
Source: Public Records
Map
Nearby Homes
- 811 Pinchot Pass Ct Unit 5
- 801 Pinchot Pass Ct Unit 7
- 5365 Ebbetts Pass Dr
- 6835 Summit View Dr
- 6671 April St
- 601 W Equinox Peak Ct
- 601 W Equinox Peak Ct Unit Homesite 2030
- 5049 Keams Ct
- 6835 Pah Rah Dr
- 6920 Pah Rah Dr
- 4956 Monrovia Dr
- 2084 Great Bluffs Ln Unit Homesite 5132
- 2094 Great Bluffs Ln Unit Homesite 5133
- 7129 Singing Tree Rd Unit Homesite 5121
- 6550 Pyramid Way Unit 61
- 4950 San Diego Ct
- 6560 Pyramid Way Unit 52
- 5651 Hunting Creek Way
- 6690 Dorchester Dr
- 5725 Crooked Stick Way
- 820 Baxter Pass Ct
- 800 Baxter Pass Ct Unit 5
- 821 Pinchot Pass Ct Unit 7
- 805 Baxter Pass Ct Unit 5
- 5216 Vidette Meadows Dr
- 5228 Vidette Meadows Dr Unit 5
- 815 Baxter Pass Ct Unit 5
- 5204 Vidette Meadows Dr
- 5196 Vidette Meadows Dr Unit 5
- 800 Pinchot Pass Ct Unit 5
- 5252 Vidette Meadows Dr Unit 5
- 820 Pinchot Pass Ct Unit 7
- 5188 Vidette Meadows Dr
- 810 Pinchot Pass Ct
- 5138 Vidette Meadows Dr Unit 7
- 5146 Vidette Meadows Dr
- 5264 Vidette Meadows Dr
- 5215 Vidette Meadows Dr Unit 5
- 5178 Vidette Meadows Dr Unit 5
- 5203 Vidette Meadows Dr Unit 5