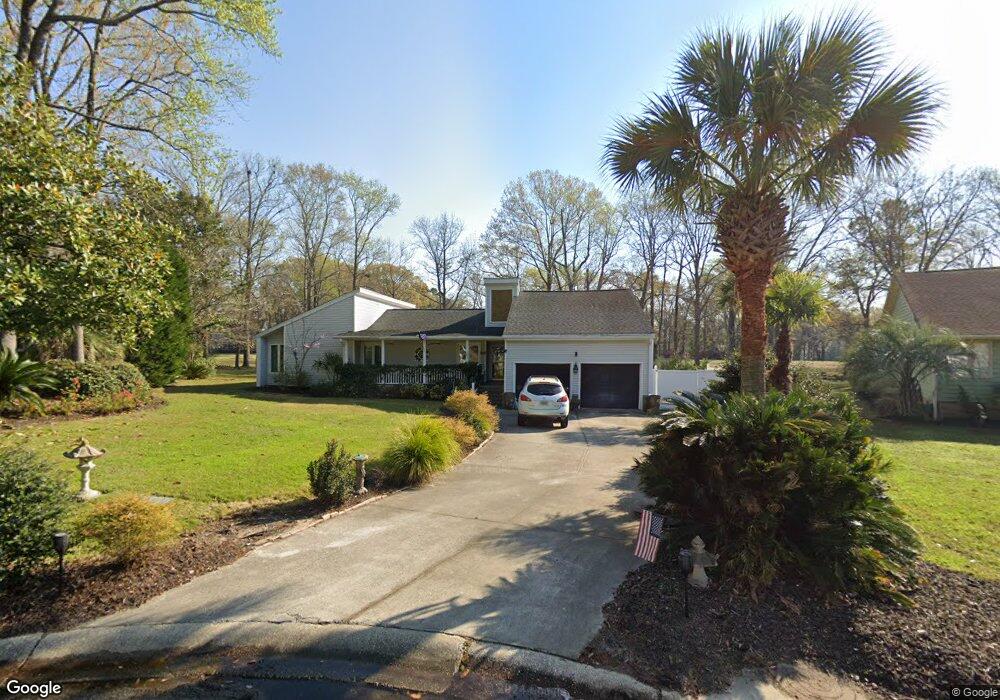
810 Indigo Ct Mount Pleasant, SC 29464
Snee Farm NeighborhoodEstimated Value: $1,017,171 - $1,177,000
3
Beds
2
Baths
2,575
Sq Ft
$414/Sq Ft
Est. Value
About This Home
This home is located at 810 Indigo Ct, Mount Pleasant, SC 29464 and is currently estimated at $1,067,293, approximately $414 per square foot. 810 Indigo Ct is a home located in Charleston County with nearby schools including James B. Edwards Elementary School, Moultrie Middle School, and Lucy Garrett Beckham High School.
Ownership History
Date
Name
Owned For
Owner Type
Purchase Details
Closed on
Sep 26, 2016
Sold by
Muhs Thomas E and Tirella Janet
Bought by
Muhs Thomas E and Muhs Janet
Current Estimated Value
Home Financials for this Owner
Home Financials are based on the most recent Mortgage that was taken out on this home.
Original Mortgage
$180,000
Outstanding Balance
$114,651
Interest Rate
3.43%
Mortgage Type
New Conventional
Estimated Equity
$952,642
Purchase Details
Closed on
Mar 9, 2011
Sold by
Hursey Ann D
Bought by
Muhs Thomas E and Tirella Janet
Home Financials for this Owner
Home Financials are based on the most recent Mortgage that was taken out on this home.
Original Mortgage
$160,500
Interest Rate
4.76%
Mortgage Type
New Conventional
Purchase Details
Closed on
May 9, 2003
Sold by
Hursey A W
Bought by
Hursey Ann D
Purchase Details
Closed on
Dec 15, 1999
Sold by
Williams Donald E and Williams Debbie I
Bought by
Hursey A W and Hursey Ann D
Create a Home Valuation Report for This Property
The Home Valuation Report is an in-depth analysis detailing your home's value as well as a comparison with similar homes in the area
Home Values in the Area
Average Home Value in this Area
Purchase History
| Date | Buyer | Sale Price | Title Company |
|---|---|---|---|
| Muhs Thomas E | -- | -- | |
| Muhs Thomas E | $350,000 | -- | |
| Hursey Ann D | -- | -- | |
| Hursey A W | $205,000 | -- |
Source: Public Records
Mortgage History
| Date | Status | Borrower | Loan Amount |
|---|---|---|---|
| Open | Muhs Thomas E | $180,000 | |
| Closed | Muhs Thomas E | $160,500 |
Source: Public Records
Tax History Compared to Growth
Tax History
| Year | Tax Paid | Tax Assessment Tax Assessment Total Assessment is a certain percentage of the fair market value that is determined by local assessors to be the total taxable value of land and additions on the property. | Land | Improvement |
|---|---|---|---|---|
| 2024 | $2,429 | $17,170 | $0 | $0 |
| 2023 | $2,429 | $17,170 | $0 | $0 |
| 2022 | $2,219 | $17,170 | $0 | $0 |
| 2021 | $2,337 | $17,170 | $0 | $0 |
| 2020 | $2,369 | $17,170 | $0 | $0 |
| 2019 | $2,080 | $14,660 | $0 | $0 |
| 2017 | $2,029 | $16,660 | $0 | $0 |
| 2016 | $1,365 | $15,430 | $0 | $0 |
| 2015 | $1,426 | $15,430 | $0 | $0 |
| 2014 | $1,223 | $0 | $0 | $0 |
| 2011 | -- | $0 | $0 | $0 |
Source: Public Records
Map
Nearby Homes
- 811 Law Ln
- 1770 Parc Vue Ave Unit 1770
- 1877 Montclair Dr Unit D
- 1866 Montclair Dr Unit 1866C
- 000 N Highway 17
- 1603 Ventura Place
- 862 Fairlawn Cir
- 1205 Ventura Place Unit R1205
- 914 Red Coat Run
- 1678 Lauda Dr
- 1308 Ventura Place Unit F1308
- 1664 Hunters Run Dr
- 1656 Lauda Dr
- 1018 Casseque Province
- 1280 Waterfront Dr
- 1709 Nantahala Blvd
- 1352 Topsail Ct
- 1134 Greenview Ln
- 1822 Falling Creek Cir
- 2011 N Highway 17 Unit 2300l