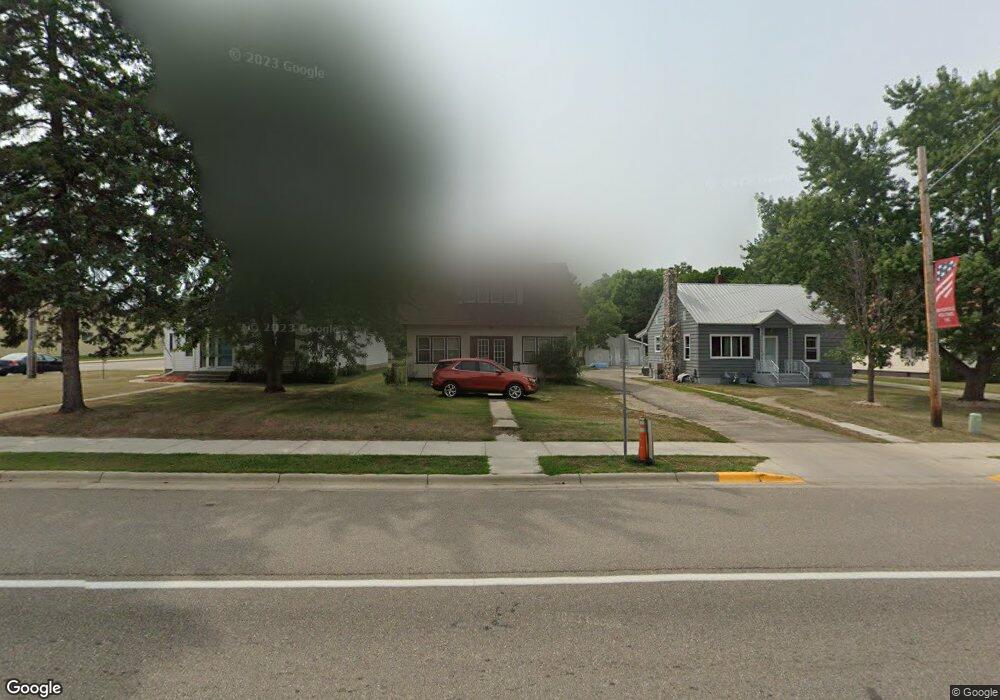
810 Main St N Browerville, MN 56438
Estimated Value: $99,628 - $142,000
--
Bed
--
Bath
780
Sq Ft
$147/Sq Ft
Est. Value
About This Home
This home is located at 810 Main St N, Browerville, MN 56438 and is currently estimated at $114,407, approximately $146 per square foot. 810 Main St N is a home located in Todd County with nearby schools including William & Mary Scherkenbach Elementary School and Browerville Secondary School.
Ownership History
Date
Name
Owned For
Owner Type
Purchase Details
Closed on
Dec 1, 2020
Sold by
Weske Roger W and Weske Marjorie B
Bought by
Hegseth Theodore R and Hegseth Jamy L
Current Estimated Value
Home Financials for this Owner
Home Financials are based on the most recent Mortgage that was taken out on this home.
Original Mortgage
$45,000
Outstanding Balance
$40,135
Interest Rate
2.8%
Mortgage Type
New Conventional
Estimated Equity
$74,272
Purchase Details
Closed on
Nov 15, 2010
Sold by
Weske Roger W and Weske Marjorie L
Bought by
Hegseth Theroore R and Jager Jamy L
Create a Home Valuation Report for This Property
The Home Valuation Report is an in-depth analysis detailing your home's value as well as a comparison with similar homes in the area
Home Values in the Area
Average Home Value in this Area
Purchase History
| Date | Buyer | Sale Price | Title Company |
|---|---|---|---|
| Hegseth Theodore R | $48,500 | Home Town Abstract & Title | |
| Hegseth Theroore R | $48,500 | None Available |
Source: Public Records
Mortgage History
| Date | Status | Borrower | Loan Amount |
|---|---|---|---|
| Open | Hegseth Theodore R | $45,000 | |
| Closed | Hegseth Theroore R | $0 |
Source: Public Records
Tax History Compared to Growth
Tax History
| Year | Tax Paid | Tax Assessment Tax Assessment Total Assessment is a certain percentage of the fair market value that is determined by local assessors to be the total taxable value of land and additions on the property. | Land | Improvement |
|---|---|---|---|---|
| 2025 | $800 | $83,600 | $5,000 | $78,600 |
| 2024 | $1,370 | $86,000 | $5,000 | $81,000 |
| 2023 | $672 | $81,300 | $5,000 | $76,300 |
| 2022 | $744 | $66,800 | $5,000 | $61,800 |
| 2021 | $768 | $62,400 | $5,000 | $57,400 |
| 2020 | $664 | $64,600 | $5,000 | $59,600 |
| 2019 | $670 | $50,100 | $5,000 | $45,100 |
| 2018 | $564 | $47,900 | $5,000 | $42,900 |
| 2017 | $588 | $35,500 | $5,000 | $30,500 |
| 2016 | $640 | $38,400 | $6,000 | $32,400 |
| 2015 | $594 | $0 | $0 | $0 |
| 2014 | -- | $0 | $0 | $0 |
Source: Public Records
Map
Nearby Homes
- 841 Main St N
- 541 Creamery Ln S
- 33896 County 21
- TBD County 61
- 0000 County 61
- 24355 350th St
- TBD 350th St
- 309 Leslie Ave E
- 27075 221st Ave
- 19167 344th St
- 19156 344th St
- 23245 380th St
- TBD County 29
- 24974 Hope Dr
- 18398 360th St
- XXX County 29
- 915 4th Ave NE
- 210 2nd Ave N
- 31393 Little Pine Ln
- 111 3rd St N