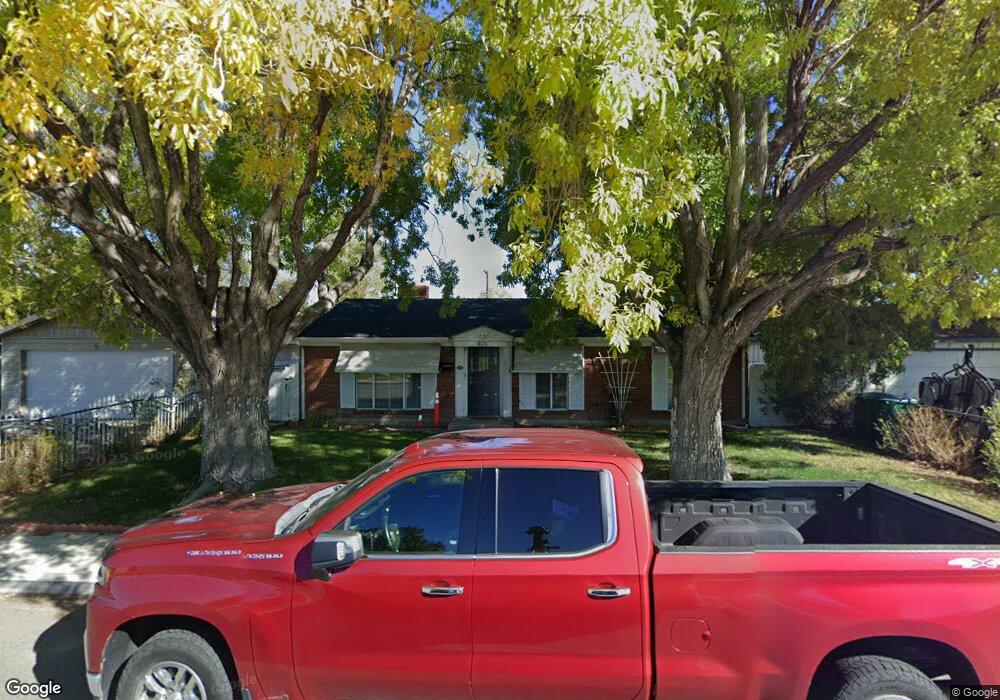
810 Marian Way Sparks, NV 89431
Downtown Sparks NeighborhoodEstimated Value: $363,942 - $424,000
3
Beds
2
Baths
1,188
Sq Ft
$336/Sq Ft
Est. Value
About This Home
This home is located at 810 Marian Way, Sparks, NV 89431 and is currently estimated at $399,236, approximately $336 per square foot. 810 Marian Way is a home located in Washoe County with nearby schools including Lincoln Park Elementary School, George L Dilworth Middle School, and Sparks High School.
Ownership History
Date
Name
Owned For
Owner Type
Purchase Details
Closed on
Jul 30, 2018
Sold by
Legg Verdie
Bought by
Legg Cynthia A
Current Estimated Value
Home Financials for this Owner
Home Financials are based on the most recent Mortgage that was taken out on this home.
Original Mortgage
$213,675
Outstanding Balance
$188,506
Interest Rate
5.25%
Mortgage Type
FHA
Estimated Equity
$210,730
Purchase Details
Closed on
Jun 21, 2017
Sold by
Blotzke Michelle Renee
Bought by
Blotzke Michele R and The Michele R Blotzke Trust
Purchase Details
Closed on
May 5, 1999
Sold by
Legg Justin V
Bought by
Blotzke Michele Renee
Home Financials for this Owner
Home Financials are based on the most recent Mortgage that was taken out on this home.
Original Mortgage
$59,100
Interest Rate
6.96%
Purchase Details
Closed on
Jun 15, 1998
Sold by
Barnard Cecelia C
Bought by
Barnard Cecelia C and Cecelia C Barnard Trust
Create a Home Valuation Report for This Property
The Home Valuation Report is an in-depth analysis detailing your home's value as well as a comparison with similar homes in the area
Home Values in the Area
Average Home Value in this Area
Purchase History
| Date | Buyer | Sale Price | Title Company |
|---|---|---|---|
| Legg Cynthia A | $260,000 | Capital Title Co Of Ne | |
| Blotzke Michele R | -- | None Available | |
| Blotzke Michele Renee | $126,000 | First American Title Co | |
| Barnard Cecelia C | -- | -- |
Source: Public Records
Mortgage History
| Date | Status | Borrower | Loan Amount |
|---|---|---|---|
| Open | Legg Cynthia A | $213,675 | |
| Previous Owner | Blotzke Michele Renee | $59,100 |
Source: Public Records
Tax History Compared to Growth
Tax History
| Year | Tax Paid | Tax Assessment Tax Assessment Total Assessment is a certain percentage of the fair market value that is determined by local assessors to be the total taxable value of land and additions on the property. | Land | Improvement |
|---|---|---|---|---|
| 2025 | $896 | $53,708 | $33,565 | $20,143 |
| 2024 | $896 | $49,959 | $30,065 | $19,894 |
| 2023 | $630 | $49,642 | $31,325 | $18,317 |
| 2022 | $846 | $41,104 | $26,180 | $14,924 |
| 2021 | $784 | $32,477 | $17,955 | $14,522 |
| 2020 | $736 | $31,210 | $16,940 | $14,270 |
| 2019 | $700 | $29,576 | $15,890 | $13,686 |
| 2018 | $668 | $24,878 | $11,725 | $13,153 |
| 2017 | $641 | $23,366 | $10,395 | $12,971 |
| 2016 | $625 | $22,251 | $9,345 | $12,906 |
| 2015 | $624 | $20,519 | $7,700 | $12,819 |
| 2014 | $606 | $18,600 | $6,440 | $12,160 |
| 2013 | -- | $16,169 | $4,270 | $11,899 |
Source: Public Records
Map
Nearby Homes
- 10 Lincoln Way
- 300 I St
- 345 H St
- 400 4th St
- 360 E Lincoln Way
- 402 5th St
- 445 Pine Meadows Dr Unit E25
- 385 Gleeson Way
- 560 Nichols Blvd
- 324 Victorian Ave
- 601 Oakwood Dr Unit 4
- 370 O'Brien Way
- 611 Oakwood Dr Unit 1
- 604 Oakwood Dr Unit 1
- 1703 1st St
- 644 Oakwood Dr Unit 2
- 8 E O St
- 512 Victorian Ave
- 684 Oakwood Dr Unit 3
- 3 Strobel Way
- 830 Marian Way
- 790 Marian Way
- 770 Marian Way
- 840 Marian Way
- 653 Stanford Way
- 657 Stanford Way
- 750 Marian Way
- 651 Stanford Way
- 850 Marian Way
- 649 Stanford Way
- 730 Marian Way
- 647 Stanford Way
- 97 Prater Way
- 737 Stanford Way
- 710 Marian Way
- 645 Stanford Way
- 639 Stanford Way
- 680 Stanford Way
- 700 Marian Way
- 690 Stanford Way