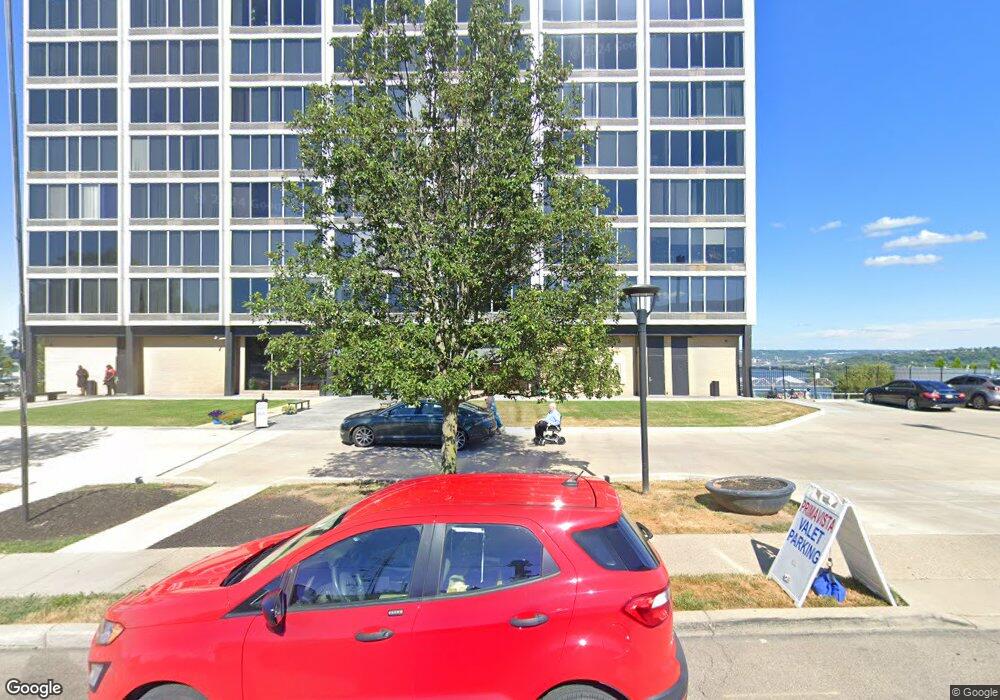
Queen's Tower 810 Matson Place Unit PH3 Cincinnati, OH 45204
East Price Hill NeighborhoodEstimated Value: $138,646 - $206,000
1
Bed
1
Bath
970
Sq Ft
$172/Sq Ft
Est. Value
About This Home
This home is located at 810 Matson Place Unit PH3, Cincinnati, OH 45204 and is currently estimated at $167,162, approximately $172 per square foot. 810 Matson Place Unit PH3 is a home located in Hamilton County with nearby schools including Robert A. Taft Information Technology High School, Gilbert A. Dater High School, and Western Hills High School.
Ownership History
Date
Name
Owned For
Owner Type
Purchase Details
Closed on
Oct 30, 2017
Sold by
Mather Susan Marie
Bought by
Vogt Properties Llc
Current Estimated Value
Purchase Details
Closed on
Jul 9, 2007
Sold by
City Lights Development Ii Llc
Bought by
Roe Roger
Home Financials for this Owner
Home Financials are based on the most recent Mortgage that was taken out on this home.
Original Mortgage
$130,240
Interest Rate
6.42%
Mortgage Type
Unknown
Purchase Details
Closed on
Jul 5, 2007
Sold by
Queenspence Llc
Bought by
City Lights Development Ii Llc
Home Financials for this Owner
Home Financials are based on the most recent Mortgage that was taken out on this home.
Original Mortgage
$130,240
Interest Rate
6.42%
Mortgage Type
Unknown
Purchase Details
Closed on
Mar 24, 2006
Sold by
City Lights Development Ii Llc
Bought by
Queenspence Llc
Create a Home Valuation Report for This Property
The Home Valuation Report is an in-depth analysis detailing your home's value as well as a comparison with similar homes in the area
Home Values in the Area
Average Home Value in this Area
Purchase History
| Date | Buyer | Sale Price | Title Company |
|---|---|---|---|
| Vogt Properties Llc | $102,000 | None Available | |
| Roe Roger | $162,800 | Attorney | |
| City Lights Development Ii Llc | -- | None Available | |
| Queenspence Llc | $363,500 | None Available |
Source: Public Records
Mortgage History
| Date | Status | Borrower | Loan Amount |
|---|---|---|---|
| Previous Owner | Roe Roger | $130,240 |
Source: Public Records
Tax History
| Year | Tax Paid | Tax Assessment Tax Assessment Total Assessment is a certain percentage of the fair market value that is determined by local assessors to be the total taxable value of land and additions on the property. | Land | Improvement |
|---|---|---|---|---|
| 2025 | $2,595 | $41,006 | $2,100 | $38,906 |
| 2023 | $2,596 | $41,006 | $2,100 | $38,906 |
| 2022 | $2,511 | $35,700 | $2,100 | $33,600 |
| 2021 | $2,470 | $35,700 | $2,100 | $33,600 |
| 2020 | $2,477 | $35,700 | $2,100 | $33,600 |
| 2019 | $1,662 | $21,802 | $2,100 | $19,702 |
| 2018 | $1,663 | $21,802 | $2,100 | $19,702 |
| 2017 | $1,602 | $21,802 | $2,100 | $19,702 |
| 2016 | $611 | $13,125 | $6,930 | $6,195 |
| 2015 | $546 | $13,125 | $6,930 | $6,195 |
| 2014 | $549 | $13,125 | $6,930 | $6,195 |
| 2013 | $552 | $15,278 | $6,300 | $8,978 |
Source: Public Records
About Queen's Tower
Map
Nearby Homes
- 2430 Maryland Ave
- 2358 Glenway Ave
- 2485 Warsaw Ave
- 2152 Staebler St
- 2360 Wilder Ave
- 2425 Glenway Ave
- 309 Mount Hope Ave
- 2519 Warsaw Ave
- 720 Grand Ave
- 817 Hawthorne Ave
- 552 Grand Ave
- 540 Grand Ave
- 538 Grand Ave
- 658 Hawthorne Ave
- 2540 Ring Place
- 2414 River Rd
- 578 Considine Ave
- 2403 Elberon Ave
- 454 Grand Ave
- 452 Grand Ave
- 810 Matson Place Unit 1201
- 810 Matson Place Unit 1408
- 810 Matson Place Unit 408
- 810 Matson Place Unit 1501
- 810 Matson Place Unit 807
- 810 Matson Place Unit 1608
- 810 Matson Place Unit 1407
- 810 Matson Place Unit PH2
- 810 Matson Place Unit 1607
- 810 Matson Place Unit 903
- 810 Matson Place Unit 602
- 810 Matson Place Unit 902
- 810 Matson Place Unit 806
- 810 Matson Place Unit 703
- 810 Matson Place Unit 601
- 810 Matson Place Unit 608
- 810 Matson Place Unit 708
- 810 Matson Place Unit 907
- 810 Matson Place Unit 1507
- 810 Matson Place Unit 1107
Your Personal Tour Guide
Ask me questions while you tour the home.