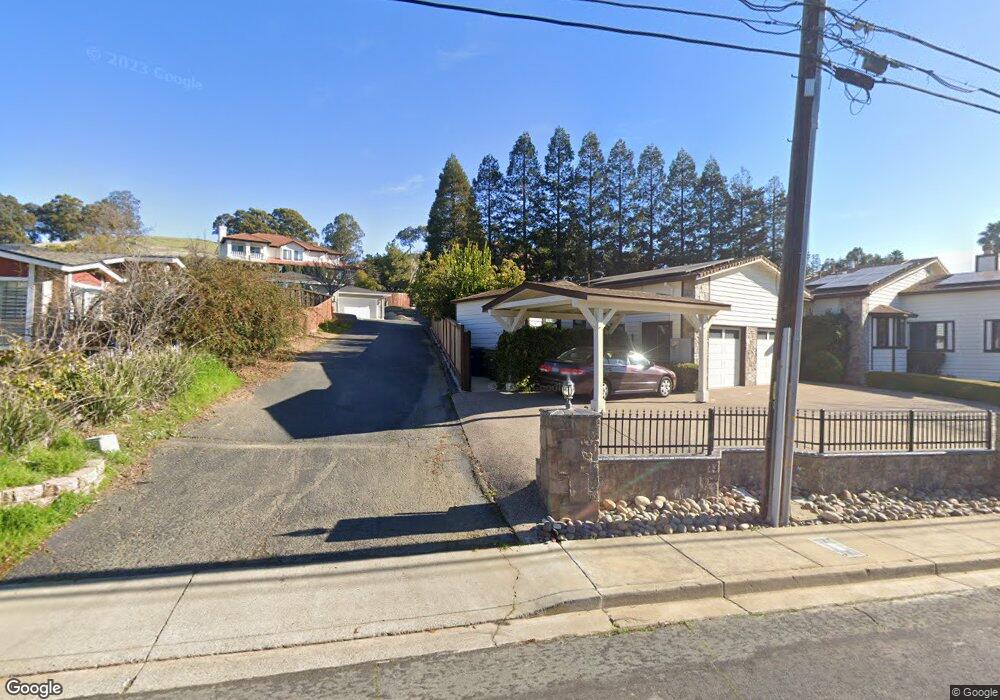
810 Navaronne Way Concord, CA 94518
Cowell Terrace NeighborhoodEstimated Value: $2,091,906 - $2,741,000
10
Beds
8
Baths
6,682
Sq Ft
$358/Sq Ft
Est. Value
About This Home
This home is located at 810 Navaronne Way, Concord, CA 94518 and is currently estimated at $2,392,227, approximately $358 per square foot. 810 Navaronne Way is a home located in Contra Costa County with nearby schools including Woodside Elementary School, Oak Grove Middle School, and Ygnacio Valley High School.
Ownership History
Date
Name
Owned For
Owner Type
Purchase Details
Closed on
Feb 25, 2022
Sold by
Reyes Sr Reynaldo M and Reyes Flordelis M
Bought by
Reynaldo M Reyes Sr And Flordelis M Reyes Rev and Reyes Florde
Current Estimated Value
Home Financials for this Owner
Home Financials are based on the most recent Mortgage that was taken out on this home.
Original Mortgage
$1,318,000
Outstanding Balance
$1,231,437
Interest Rate
3.92%
Mortgage Type
New Conventional
Estimated Equity
$1,160,790
Purchase Details
Closed on
Dec 11, 2013
Sold by
Reyes Flordelis M and Reyes Reynaldo M
Bought by
Reyes Reynaldo M and Reyes Flordelis
Purchase Details
Closed on
Jul 9, 2007
Sold by
Reyes Reynaldo M and Reyes Flordelis M
Bought by
Reyes Flordelis M and Reyes Reynaldo M
Home Financials for this Owner
Home Financials are based on the most recent Mortgage that was taken out on this home.
Original Mortgage
$330,000
Interest Rate
6.41%
Mortgage Type
Credit Line Revolving
Create a Home Valuation Report for This Property
The Home Valuation Report is an in-depth analysis detailing your home's value as well as a comparison with similar homes in the area
Home Values in the Area
Average Home Value in this Area
Purchase History
| Date | Buyer | Sale Price | Title Company |
|---|---|---|---|
| Reynaldo M Reyes Sr And Flordelis M Reyes Rev | -- | New Title Company Name | |
| Reyes Reynaldo M | -- | New Title Company Name | |
| Reyes Reynaldo M | -- | None Available | |
| Reyes Flordelis M | -- | Fidelity National Title Co |
Source: Public Records
Mortgage History
| Date | Status | Borrower | Loan Amount |
|---|---|---|---|
| Open | Reyes Reynaldo M | $1,318,000 | |
| Previous Owner | Reyes Flordelis M | $330,000 |
Source: Public Records
Tax History
| Year | Tax Paid | Tax Assessment Tax Assessment Total Assessment is a certain percentage of the fair market value that is determined by local assessors to be the total taxable value of land and additions on the property. | Land | Improvement |
|---|---|---|---|---|
| 2025 | $15,366 | $1,166,218 | $165,225 | $1,000,993 |
| 2024 | $14,576 | $1,133,352 | $161,986 | $971,366 |
| 2023 | $14,576 | $1,111,130 | $158,810 | $952,320 |
| 2022 | $14,011 | $1,089,345 | $155,697 | $933,648 |
| 2021 | $14,956 | $1,067,987 | $152,645 | $915,342 |
| 2019 | $12,545 | $1,036,312 | $148,118 | $888,194 |
| 2018 | $12,059 | $1,015,993 | $145,214 | $870,779 |
| 2017 | $11,676 | $996,072 | $142,367 | $853,705 |
| 2016 | $11,392 | $976,542 | $139,576 | $836,966 |
| 2015 | $11,305 | $961,874 | $137,480 | $824,394 |
| 2014 | $11,149 | $943,033 | $134,787 | $808,246 |
Source: Public Records
Map
Nearby Homes
- 4275 Marietta Ct
- 4252 El Cerrito Rd
- 880 Madigan Ave
- 4058 Treat Blvd
- 1084 Jamie Dr
- 4040 Davenport Ln
- 1048 Peppermill Ct
- 4362 Lynn Dr
- 2745 Minert Rd
- 3739 Northridge Dr
- 2605 Ryan Rd
- 2190 Charlotte Ave
- 1200 Stonecrest Ln
- 3181 Santa Maria Dr
- 91 Terrace Ct
- 3055 Treat Blvd Unit 36
- 20 Terrace Dr
- 4380 Saint Charles Place
- 4044 Cowell Rd
- 4317 Cowell Rd
- 814 Navaronne Way
- 824 Navaronne Way
- 816 Navaronne Way Unit 818
- 806 Navaronne Way
- 818 Navaronne Way
- 1035 Molad Ct
- 826 Navaronne Way
- 1045 Molad Ct
- 1025 Molad Ct
- 836 Navaronne Way
- 1015 Molad Ct
- 1055 Molad Ct
- 830 Navaronne Way
- 3499 Viola Place
- 1020 Molad Ct
- 1030 Molad Ct
- 842 Navaronne Way
- 1010 Molad Ct
- 823 Navaronne Way
- 3498 Viola Place
Your Personal Tour Guide
Ask me questions while you tour the home.