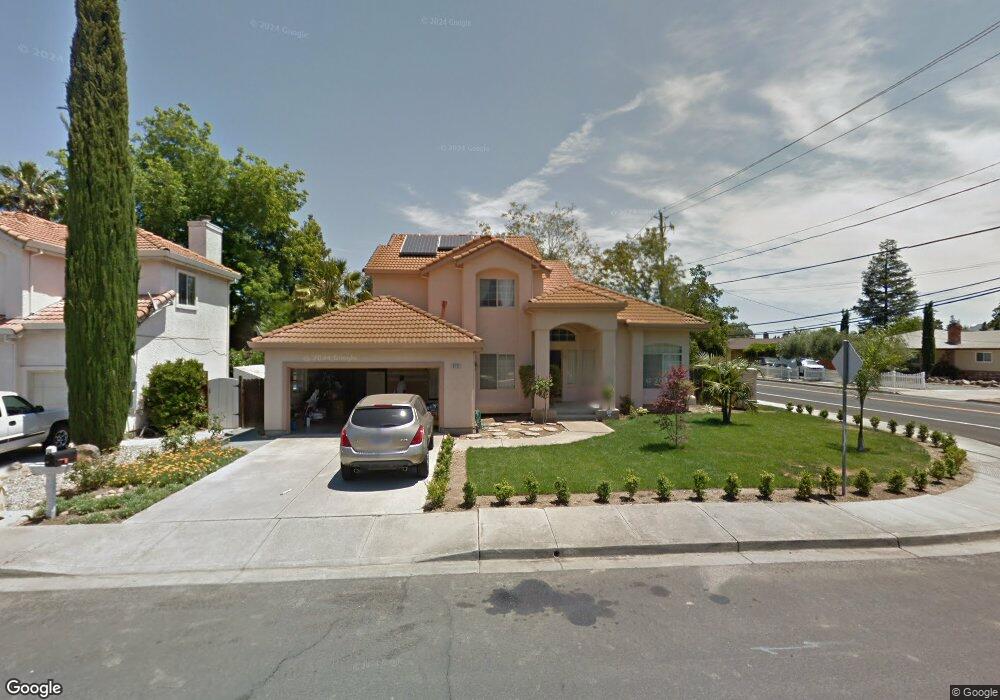
810 Nicholas Ct Brentwood, CA 94513
Estimated Value: $725,000 - $765,000
4
Beds
3
Baths
2,102
Sq Ft
$355/Sq Ft
Est. Value
About This Home
This home is located at 810 Nicholas Ct, Brentwood, CA 94513 and is currently estimated at $745,564, approximately $354 per square foot. 810 Nicholas Ct is a home located in Contra Costa County with nearby schools including Brentwood Elementary School, Edna Hill Middle School, and Liberty High School.
Ownership History
Date
Name
Owned For
Owner Type
Purchase Details
Closed on
Apr 13, 2016
Sold by
Emeson Uche Joe and Umeh Uchechukwu
Bought by
Emeson Uche Joe
Current Estimated Value
Purchase Details
Closed on
Jun 5, 2002
Sold by
Umeh Ogwo J
Bought by
Umeh Uchechukwu
Home Financials for this Owner
Home Financials are based on the most recent Mortgage that was taken out on this home.
Original Mortgage
$293,550
Outstanding Balance
$124,558
Interest Rate
6.86%
Mortgage Type
Purchase Money Mortgage
Estimated Equity
$621,006
Purchase Details
Closed on
Aug 28, 1997
Sold by
Vaiasicca Shirley J and Vaiasicca Carl
Bought by
Sneed Larry and Sneed Cherie A
Home Financials for this Owner
Home Financials are based on the most recent Mortgage that was taken out on this home.
Original Mortgage
$35,000
Interest Rate
7.54%
Mortgage Type
Purchase Money Mortgage
Create a Home Valuation Report for This Property
The Home Valuation Report is an in-depth analysis detailing your home's value as well as a comparison with similar homes in the area
Home Values in the Area
Average Home Value in this Area
Purchase History
| Date | Buyer | Sale Price | Title Company |
|---|---|---|---|
| Emeson Uche Joe | -- | None Available | |
| Umeh Uchechukwu | -- | North American Title Co | |
| Umeh Uchechukwu | $309,000 | North American Title Co | |
| Sneed Larry | $40,000 | First American Title Guarant |
Source: Public Records
Mortgage History
| Date | Status | Borrower | Loan Amount |
|---|---|---|---|
| Open | Umeh Uchechukwu | $293,550 | |
| Previous Owner | Sneed Larry | $35,000 |
Source: Public Records
Tax History Compared to Growth
Tax History
| Year | Tax Paid | Tax Assessment Tax Assessment Total Assessment is a certain percentage of the fair market value that is determined by local assessors to be the total taxable value of land and additions on the property. | Land | Improvement |
|---|---|---|---|---|
| 2025 | $5,103 | $456,464 | $118,912 | $337,552 |
| 2024 | $5,020 | $447,515 | $116,581 | $330,934 |
| 2023 | $5,020 | $438,742 | $114,296 | $324,446 |
| 2022 | $4,937 | $430,140 | $112,055 | $318,085 |
| 2021 | $4,806 | $421,707 | $109,858 | $311,849 |
| 2019 | $4,806 | $409,200 | $106,600 | $302,600 |
| 2018 | $4,550 | $401,177 | $104,510 | $296,667 |
| 2017 | $4,554 | $393,311 | $102,461 | $290,850 |
| 2016 | $4,394 | $385,600 | $100,452 | $285,148 |
| 2015 | $4,272 | $379,809 | $98,944 | $280,865 |
| 2014 | $4,254 | $372,370 | $97,006 | $275,364 |
Source: Public Records
Map
Nearby Homes
- 951 Dainty Ave
- 967 Dainty Ave
- 524 Bougainvilla Ct
- 801 Villa Terrace
- 875 Villa Terrace
- 800 Queen Palm Ln
- 818 Queen Palm Ln
- 730 Bramhall St
- 0 Road 3
- 841 Fan Palm Ln
- 0 Briones Valley Rd Unit 41100773
- 0 Briones Valley Rd Unit 41100771
- 927 Island Palm Way
- 855 Caribou Terrace
- 810 Coventry Cir
- 8500 Brentwood Blvd
- 3660 Walnut Blvd Unit 40
- 3660 Walnut Blvd Unit 72
- 3660 Walnut Blvd Unit 46
- 3660 Walnut Blvd Unit 65
- 820 Nicholas Ct
- 875 Dainty Ave
- 830 Nicholas Ct
- 805 Nicholas Ct
- 867 Dainty Ave
- 882 Dainty Ave
- 815 Nicholas Ct
- 902 Dainty Ave
- 805 Fieldstone Ct
- 825 Nicholas Ct
- 840 Nicholas Ct
- 874 Dainty Ave
- 920 Dainty Ave
- 931 Dainty Ave
- 815 Fieldstone Ct
- 835 Nicholas Ct
- 775 Nebergall Ct
- 930 Dainty Ave
- 858 Dainty Ave
- 774 Nebergall Ct