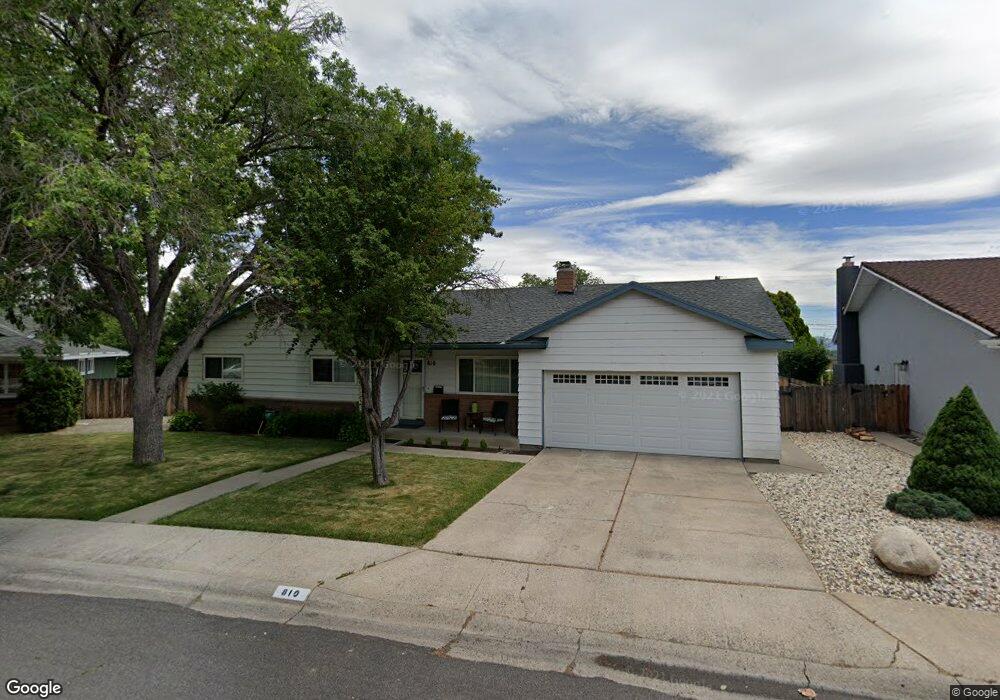
810 Rhode Island Dr Reno, NV 89503
Kings Row NeighborhoodEstimated Value: $479,000 - $513,742
3
Beds
2
Baths
1,296
Sq Ft
$383/Sq Ft
Est. Value
About This Home
This home is located at 810 Rhode Island Dr, Reno, NV 89503 and is currently estimated at $496,186, approximately $382 per square foot. 810 Rhode Island Dr is a home located in Washoe County with nearby schools including Elmcrest Elementary School, Archie Clayton Pre-AP Academy, and Robert McQueen High School.
Ownership History
Date
Name
Owned For
Owner Type
Purchase Details
Closed on
Jun 12, 2019
Sold by
Fetterman Valerie
Bought by
Dickey Diane K
Current Estimated Value
Home Financials for this Owner
Home Financials are based on the most recent Mortgage that was taken out on this home.
Original Mortgage
$114,977
Outstanding Balance
$101,636
Interest Rate
4.37%
Mortgage Type
FHA
Estimated Equity
$394,550
Purchase Details
Closed on
Jun 10, 2004
Sold by
Thomas Howard D and Thomas Karen J
Bought by
Fetterman Roger N and Fetterman Valerie
Purchase Details
Closed on
Apr 5, 1995
Sold by
Vidano Robert Joseph and Vidano Marilyn Jean
Bought by
Thomas Howard D and Thomas Karen J
Home Financials for this Owner
Home Financials are based on the most recent Mortgage that was taken out on this home.
Original Mortgage
$75,000
Interest Rate
8.6%
Create a Home Valuation Report for This Property
The Home Valuation Report is an in-depth analysis detailing your home's value as well as a comparison with similar homes in the area
Home Values in the Area
Average Home Value in this Area
Purchase History
| Date | Buyer | Sale Price | Title Company |
|---|---|---|---|
| Dickey Diane K | $283,000 | Stewart Title Company | |
| Fetterman Roger N | $253,000 | Stewart Title Of Northern Nv | |
| Thomas Howard D | $102,000 | Stewart Title |
Source: Public Records
Mortgage History
| Date | Status | Borrower | Loan Amount |
|---|---|---|---|
| Open | Dickey Diane K | $114,977 | |
| Previous Owner | Thomas Howard D | $75,000 |
Source: Public Records
Tax History Compared to Growth
Tax History
| Year | Tax Paid | Tax Assessment Tax Assessment Total Assessment is a certain percentage of the fair market value that is determined by local assessors to be the total taxable value of land and additions on the property. | Land | Improvement |
|---|---|---|---|---|
| 2025 | $978 | $64,089 | $41,785 | $22,304 |
| 2024 | $978 | $61,402 | $39,359 | $22,043 |
| 2023 | $950 | $61,545 | $41,160 | $20,385 |
| 2022 | $923 | $49,718 | $33,075 | $16,643 |
| 2021 | $896 | $38,545 | $22,307 | $16,238 |
| 2020 | $870 | $36,956 | $20,984 | $15,972 |
| 2019 | $830 | $36,363 | $21,315 | $15,048 |
| 2018 | $709 | $29,625 | $15,178 | $14,447 |
| 2017 | $686 | $27,777 | $13,561 | $14,216 |
| 2016 | $764 | $26,129 | $11,907 | $14,222 |
| 2015 | $194 | $23,988 | $10,106 | $13,882 |
| 2014 | $732 | $22,187 | $9,004 | $13,183 |
| 2013 | -- | $19,215 | $6,431 | $12,784 |
Source: Public Records
Map
Nearby Homes
- 790 Rhode Island Dr
- 830 Rhode Island Dr
- 840 Rhode Island Dr
- 805 Rhode Island Dr
- 845 Rhode Island Dr
- 790 Barry M Cir
- 785 Rhode Island Dr
- 760 Barry M Cir
- 750 Rhode Island Dr
- 750 Barry M Cir
- 860 Rhode Island Dr
- 780 Barry M Cir
- 770 Barry M Cir
- 765 Rhode Island Dr
- 730 Barry M Cir
- 880 Pennsylvania Dr
- 850 Pennsylvania Dr
- 895 Rhode Island Dr
- 2395 W 7th St
- 0 W 7th St