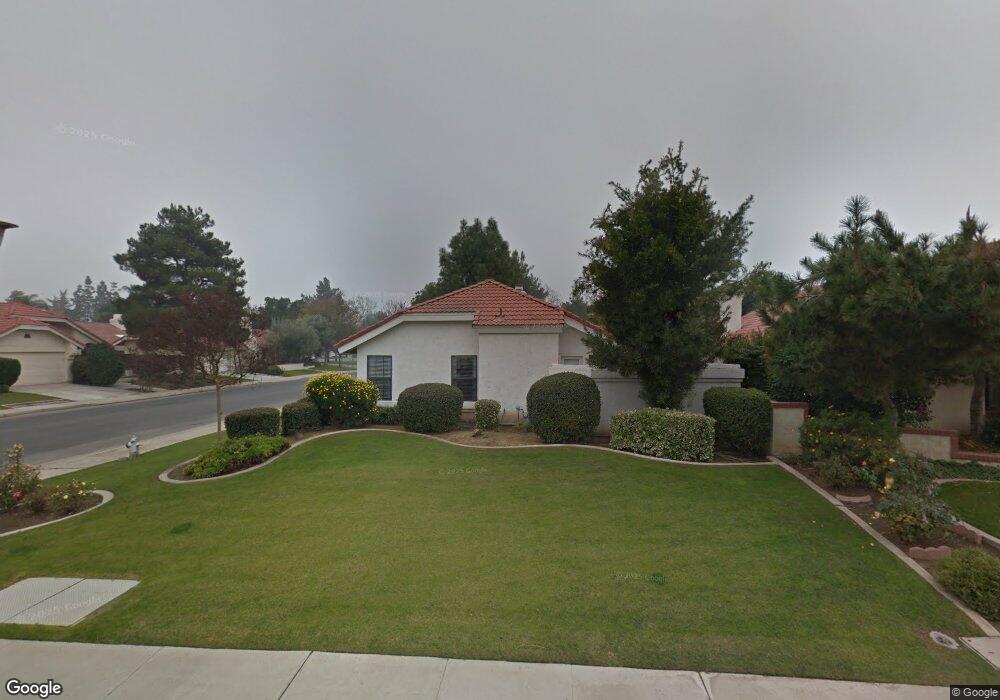
8101 Birmingham St Unit 2 Bakersfield, CA 93311
CSU Bakersfield NeighborhoodEstimated Value: $327,000 - $408,000
2
Beds
2
Baths
1,348
Sq Ft
$270/Sq Ft
Est. Value
About This Home
This home is located at 8101 Birmingham St Unit 2, Bakersfield, CA 93311 and is currently estimated at $364,578, approximately $270 per square foot. 8101 Birmingham St Unit 2 is a home located in Kern County with nearby schools including Stockdale Elementary School, O.J. Actis Junior High School, and Bakersfield High School.
Ownership History
Date
Name
Owned For
Owner Type
Purchase Details
Closed on
Jun 10, 2014
Sold by
Delpapa Melinda S and Bartell Melinda S
Bought by
Holt Jerry and Holt Sandra
Current Estimated Value
Home Financials for this Owner
Home Financials are based on the most recent Mortgage that was taken out on this home.
Original Mortgage
$180,805
Outstanding Balance
$137,369
Interest Rate
4.17%
Mortgage Type
VA
Estimated Equity
$227,209
Purchase Details
Closed on
May 6, 2010
Sold by
Ayres Paul G and Betty Alice Ayres Trust
Bought by
Bartell Melinda S
Home Financials for this Owner
Home Financials are based on the most recent Mortgage that was taken out on this home.
Original Mortgage
$81,800
Interest Rate
4.87%
Mortgage Type
FHA
Purchase Details
Closed on
Jun 30, 2005
Sold by
Ayres Betty Alice and Betty Alice Ayres Trust
Bought by
Ayres Betty Alice and Ayres Paul G
Purchase Details
Closed on
Apr 11, 1995
Sold by
Ayres Betty Alice
Bought by
Ayres Betty Alice and Betty Alice Ayres Trust
Create a Home Valuation Report for This Property
The Home Valuation Report is an in-depth analysis detailing your home's value as well as a comparison with similar homes in the area
Home Values in the Area
Average Home Value in this Area
Purchase History
| Date | Buyer | Sale Price | Title Company |
|---|---|---|---|
| Holt Jerry | $177,000 | Tsi Title Company | |
| Delpapa Melinda S | -- | Tsi Title Company Of Ca Inc | |
| Bartell Melinda S | $120,000 | Chicago Title Company | |
| Ayres Betty Alice | -- | -- | |
| Ayres Betty Alice | -- | -- |
Source: Public Records
Mortgage History
| Date | Status | Borrower | Loan Amount |
|---|---|---|---|
| Open | Holt Jerry | $180,805 | |
| Previous Owner | Bartell Melinda S | $81,800 |
Source: Public Records
Tax History Compared to Growth
Tax History
| Year | Tax Paid | Tax Assessment Tax Assessment Total Assessment is a certain percentage of the fair market value that is determined by local assessors to be the total taxable value of land and additions on the property. | Land | Improvement |
|---|---|---|---|---|
| 2025 | $3,251 | $216,965 | $49,029 | $167,936 |
| 2024 | $3,200 | $212,712 | $48,068 | $164,644 |
| 2023 | $3,200 | $208,542 | $47,126 | $161,416 |
| 2022 | $3,072 | $204,453 | $46,202 | $158,251 |
| 2021 | $2,956 | $200,446 | $45,297 | $155,149 |
| 2020 | $2,903 | $198,392 | $44,833 | $153,559 |
| 2019 | $2,865 | $198,392 | $44,833 | $153,559 |
| 2018 | $2,740 | $190,691 | $43,093 | $147,598 |
| 2017 | $2,700 | $186,953 | $42,249 | $144,704 |
| 2016 | $2,531 | $183,288 | $41,421 | $141,867 |
| 2015 | $2,508 | $180,536 | $40,799 | $139,737 |
| 2014 | $1,944 | $125,414 | $31,353 | $94,061 |
Source: Public Records
Map
Nearby Homes
- 600 Berwick St
- 8212 Hastings St Unit 4
- 1116 Sussex Cir
- 1000 Halterio Ct
- 7800 de Colores Ct
- 1405 Calle Hermosa
- 105 Camino Del Oeste
- 7805 Buena Tierra Ct
- 820 Ferdinand Ct
- 7705 Calle Cerca
- 7601 Calle Corta
- 7500 El Roble Ct
- 7612 Las Cruces Ave
- 8214 Prentice Hall Dr
- 8304 Prentice Hall Dr
- 419 Starmount Ln
- 1509 Calle Castana
- 1033 Tam o Shanter Dr
- 1808 Delacorte Dr
- 8710 Beau Maison Way
- 8105 Birmingham St Unit 2
- 8109 Birmingham St Unit 2
- 8112 Chaucer St Unit 1
- 8116 Chaucer St
- 700 Southampton Blvd
- 704 Southampton Blvd
- 8201 Birmingham St
- 8120 Chaucer St
- 8100 Birmingham St Unit 2
- 608 Southampton Blvd
- 8104 Chaucer St
- 8200 Chaucer St
- 8205 Birmingham St
- 604 Southampton Blvd
- 8100 Chaucer St
- 608 Portsmouth St Unit 2
- 8202 Chaucer St
- 8204 Chaucer St
- 8200 Birmingham St
- 8209 Birmingham St