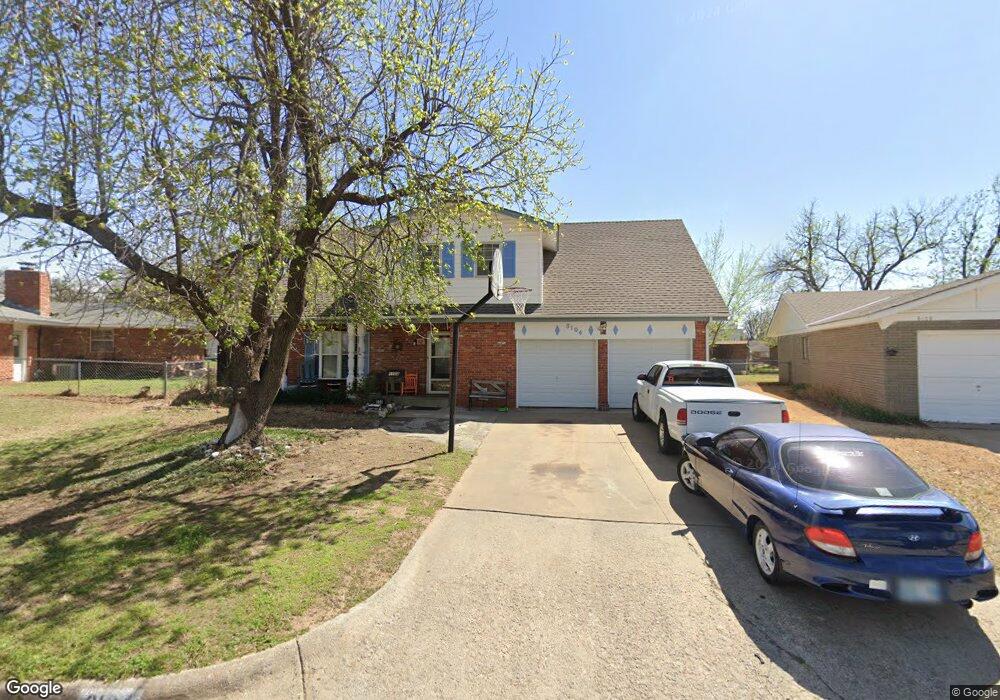
8104 NW 28th St Bethany, OK 73008
Estimated Value: $228,000 - $239,000
4
Beds
2
Baths
1,886
Sq Ft
$123/Sq Ft
Est. Value
About This Home
This home is located at 8104 NW 28th St, Bethany, OK 73008 and is currently estimated at $231,726, approximately $122 per square foot. 8104 NW 28th St is a home located in Oklahoma County with nearby schools including Lake Park Elementary School, Western Oaks Middle School, and Putnam City West High School.
Ownership History
Date
Name
Owned For
Owner Type
Purchase Details
Closed on
Jul 14, 2009
Sold by
Subasic Abdulah and Subasic Munevera
Bought by
Norwood Jason D and Norwood Antonia R
Current Estimated Value
Home Financials for this Owner
Home Financials are based on the most recent Mortgage that was taken out on this home.
Original Mortgage
$114,291
Outstanding Balance
$74,896
Interest Rate
5.39%
Mortgage Type
FHA
Estimated Equity
$156,830
Purchase Details
Closed on
Oct 17, 2003
Sold by
Morgan Phillip A and Morgan Ronda C
Bought by
Subasic Abdulah and Subasic Munevera
Purchase Details
Closed on
Sep 17, 2001
Sold by
Cockrim Ronda C and Morgan Ronda C
Bought by
Morgan Phillip A and Morgan Ronda C
Purchase Details
Closed on
Dec 21, 2000
Sold by
Mcalister Thomas J and Mcalister Donna F
Bought by
Cockrum Ronda C
Create a Home Valuation Report for This Property
The Home Valuation Report is an in-depth analysis detailing your home's value as well as a comparison with similar homes in the area
Home Values in the Area
Average Home Value in this Area
Purchase History
| Date | Buyer | Sale Price | Title Company |
|---|---|---|---|
| Norwood Jason D | $116,500 | American Guaranty Title Co | |
| Subasic Abdulah | $109,000 | Stewart Abstract & Title Of | |
| Morgan Phillip A | -- | -- | |
| Cockrum Ronda C | $94,000 | Stewart Abstract & Title |
Source: Public Records
Mortgage History
| Date | Status | Borrower | Loan Amount |
|---|---|---|---|
| Open | Norwood Jason D | $114,291 |
Source: Public Records
Tax History Compared to Growth
Tax History
| Year | Tax Paid | Tax Assessment Tax Assessment Total Assessment is a certain percentage of the fair market value that is determined by local assessors to be the total taxable value of land and additions on the property. | Land | Improvement |
|---|---|---|---|---|
| 2024 | $2,059 | $18,262 | $3,715 | $14,547 |
| 2023 | $2,059 | $17,731 | $2,943 | $14,788 |
| 2022 | $1,825 | $17,213 | $3,119 | $14,094 |
| 2021 | $1,761 | $16,712 | $3,457 | $13,255 |
| 2020 | $1,700 | $16,226 | $3,576 | $12,650 |
| 2019 | $1,641 | $15,754 | $3,193 | $12,561 |
| 2018 | $1,580 | $15,296 | $0 | $0 |
| 2017 | $1,539 | $14,849 | $3,266 | $11,583 |
| 2016 | $1,475 | $14,464 | $3,266 | $11,198 |
| 2015 | $1,389 | $14,122 | $3,041 | $11,081 |
| 2014 | $1,328 | $14,101 | $3,041 | $11,060 |
Source: Public Records
Map
Nearby Homes
- 8209 NW 28th St
- 8008 NW 27th St
- 2912 N Shannon Ave
- 8213 NW 25th St
- 2928 N Downing Ave
- 3120 N Pinecrest Dr
- 7728 NW 30th St
- 2121 N Markwell Ave
- 2312 Overholser Ct
- 8004 NW 20th St
- 7525 NW 25th Terrace
- 7521 NW 25th Terrace
- 7525 NW 25th St
- 7433 NW 31st St
- 3725 N Grant Ave
- 7401 NW 28th Terrace
- 7401 NW 30th Terrace
- 3808 N Markwell Ave
- 7800 NW 37th St
- 8209 NW 38th St
- 8108 NW 28th St
- 8100 NW 28th St
- 2809 N Mcmillan Ave
- 8113 NW 27th St
- 8112 NW 28th St
- 8109 NW 27th St
- 8117 NW 27th St
- 8101 NW 28th St
- 2805 N Mcmillan Ave
- 8121 NW 27th St
- 8105 NW 27th St
- 8105 NW 28th St
- 8116 NW 28th St
- 2832 Mcmillan Cir
- 2836 N Mcmillan Ave
- 2832 Mcmillan Cir
- 8125 NW 27th St
- 8109 NW 28th St
- 2801 N Mcmillan Ave
- 2904 N Mcmillan Ave