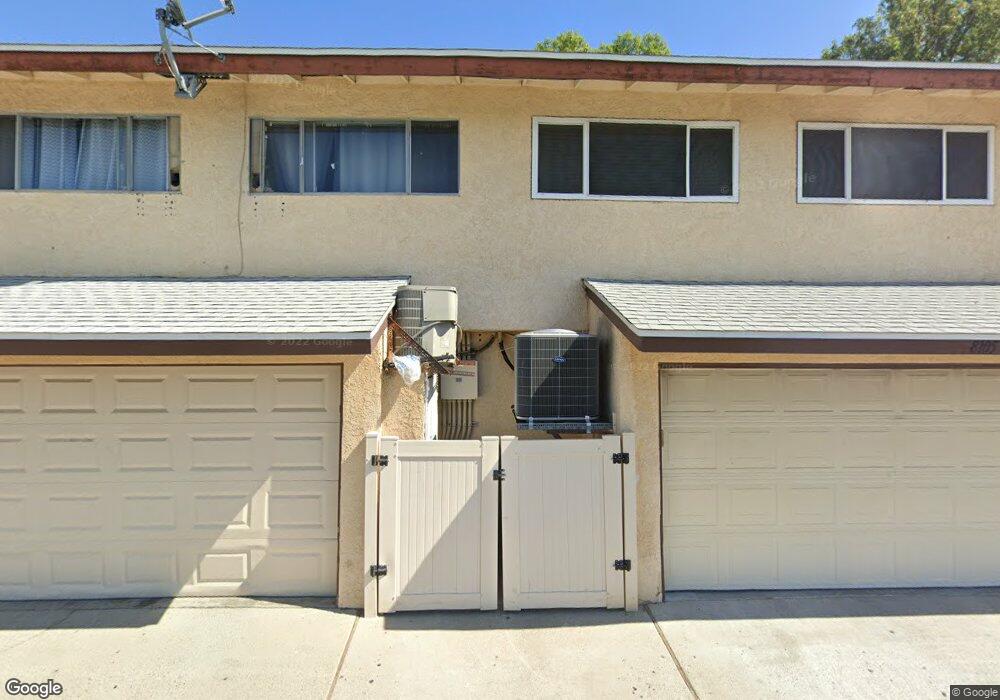
8105 Canby Ave Unit 6 Reseda, CA 91335
Estimated Value: $577,000 - $632,000
4
Beds
3
Baths
1,717
Sq Ft
$348/Sq Ft
Est. Value
About This Home
This home is located at 8105 Canby Ave Unit 6, Reseda, CA 91335 and is currently estimated at $597,197, approximately $347 per square foot. 8105 Canby Ave Unit 6 is a home located in Los Angeles County with nearby schools including Blythe Street Elementary, Northridge Middle School, and Northridge Academy High.
Ownership History
Date
Name
Owned For
Owner Type
Purchase Details
Closed on
Dec 19, 2006
Sold by
Choi Hyun Sook
Bought by
Choi Sun Woo
Current Estimated Value
Home Financials for this Owner
Home Financials are based on the most recent Mortgage that was taken out on this home.
Original Mortgage
$344,000
Outstanding Balance
$235,457
Interest Rate
9.1%
Mortgage Type
New Conventional
Estimated Equity
$361,740
Purchase Details
Closed on
Aug 8, 1995
Sold by
California Federal Bank Fsb
Bought by
Choi Sun Woo
Home Financials for this Owner
Home Financials are based on the most recent Mortgage that was taken out on this home.
Original Mortgage
$72,000
Interest Rate
7.97%
Purchase Details
Closed on
Mar 29, 1995
Sold by
Urenda Eduardo and California Fsla
Bought by
California Federal Bank Fsb and California Fsla
Create a Home Valuation Report for This Property
The Home Valuation Report is an in-depth analysis detailing your home's value as well as a comparison with similar homes in the area
Home Values in the Area
Average Home Value in this Area
Purchase History
| Date | Buyer | Sale Price | Title Company |
|---|---|---|---|
| Choi Sun Woo | -- | Chicago Title Co | |
| Choi Sun Woo | $90,000 | Southland Title | |
| California Federal Bank Fsb | $136,155 | North American Title |
Source: Public Records
Mortgage History
| Date | Status | Borrower | Loan Amount |
|---|---|---|---|
| Open | Choi Sun Woo | $344,000 | |
| Previous Owner | Choi Sun Woo | $72,000 |
Source: Public Records
Tax History Compared to Growth
Tax History
| Year | Tax Paid | Tax Assessment Tax Assessment Total Assessment is a certain percentage of the fair market value that is determined by local assessors to be the total taxable value of land and additions on the property. | Land | Improvement |
|---|---|---|---|---|
| 2025 | $2,036 | $149,484 | $29,888 | $119,596 |
| 2024 | $2,036 | $146,553 | $29,302 | $117,251 |
| 2023 | $2,001 | $143,680 | $28,728 | $114,952 |
| 2022 | $1,914 | $140,864 | $28,165 | $112,699 |
| 2021 | $1,882 | $138,103 | $27,613 | $110,490 |
| 2019 | $1,829 | $134,009 | $26,795 | $107,214 |
| 2018 | $1,787 | $131,382 | $26,270 | $105,112 |
| 2016 | $1,692 | $126,281 | $25,250 | $101,031 |
| 2015 | $1,669 | $124,385 | $24,871 | $99,514 |
| 2014 | $1,683 | $121,949 | $24,384 | $97,565 |
Source: Public Records
Map
Nearby Homes
- 8031 Canby Ave Unit 4
- 18361 Strathern St Unit 3
- 18411 Strathern St Unit 1
- 8055 Canby Ave Unit 5
- 8051 Etiwanda Ave
- 8134 Baird Ave
- 18540 Arminta St
- 18643 Strathern St
- 8045 Garden Grove Ave
- 18630 Cantara St
- 18649 Willard St
- 8223 Garden Grove Ave
- 8350 Reseda Blvd
- 7719 Nestle Ave
- 7701 Baird Ave
- 18352 Keswick St Unit 2
- 7641 Reseda Blvd Unit 108Z
- 7732 Garden Grove Ave
- 18708 Schoenborn St
- 18347 Saticoy St Unit 17
- 8051 Canby Ave Unit 1
- 8031 Canby Ave
- 18421 Strathern St
- 18411 Strathern St Unit 5
- 8105 Canby Ave Unit 5
- 8105 Canby Ave Unit 4
- 8105 Canby Ave Unit 3
- 8105 Canby Ave Unit 2
- 8105 Canby Ave Unit 1
- 8051 Canby Ave Unit 1
- 8051 Canby Ave Unit 2
- 8051 Canby Ave Unit 3
- 8051 Canby Ave Unit 4
- 8051 Canby Ave Unit 5
- 8051 Canby Ave Unit 6
- 8055 Canby Ave Unit 6
- 8055 Canby Ave Unit 4
- 8055 Canby Ave Unit 3
- 8055 Canby Ave Unit 2
- 8055 Canby Ave Unit 1