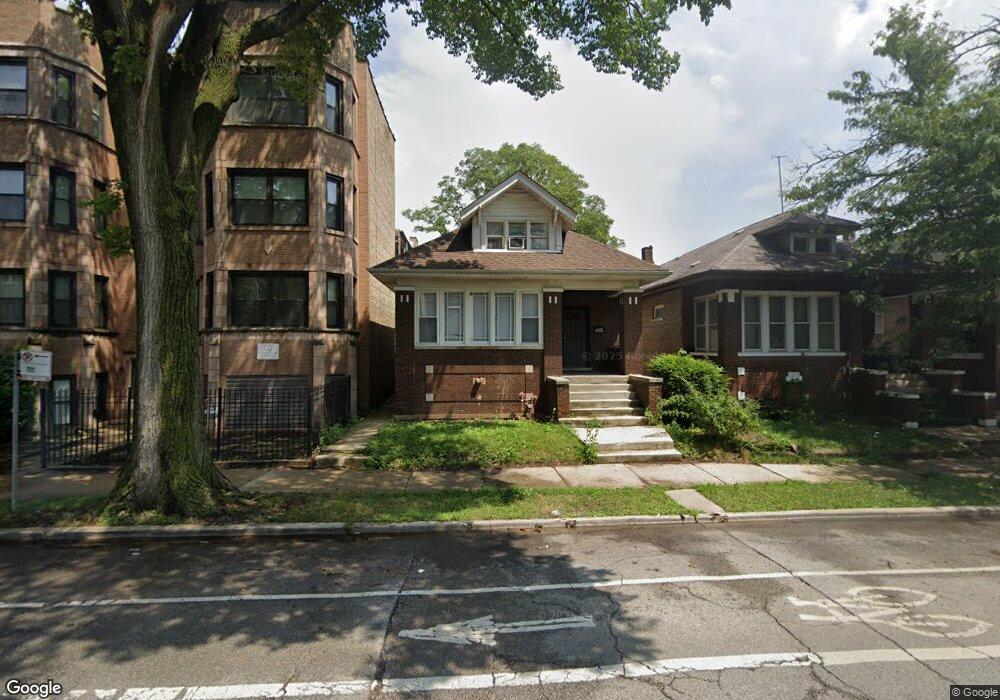
8105 S Loomis Blvd Chicago, IL 60620
Auburn Gresham NeighborhoodEstimated Value: $190,000 - $229,000
4
Beds
1
Bath
1,328
Sq Ft
$156/Sq Ft
Est. Value
About This Home
This home is located at 8105 S Loomis Blvd, Chicago, IL 60620 and is currently estimated at $206,966, approximately $155 per square foot. 8105 S Loomis Blvd is a home located in Cook County with nearby schools including Cook Elementary School, Emil G. Hirsch Metropolitan High School, and LEARN Hunter Perkins.
Ownership History
Date
Name
Owned For
Owner Type
Purchase Details
Closed on
Mar 14, 2021
Sold by
Chicago Opportunity Properties Llc
Bought by
Bpdm Properties 2018 1 Llc
Current Estimated Value
Purchase Details
Closed on
Oct 18, 2018
Sold by
Pinewood Estates Llc
Bought by
Chicago Opportunity Properties Llc
Purchase Details
Closed on
Feb 5, 2014
Sold by
County Of Cook
Bought by
Pinewood Estates Llc
Purchase Details
Closed on
Aug 31, 2006
Sold by
Moore William
Bought by
Watson Christine K
Home Financials for this Owner
Home Financials are based on the most recent Mortgage that was taken out on this home.
Original Mortgage
$137,600
Interest Rate
7.99%
Mortgage Type
Unknown
Purchase Details
Closed on
Oct 27, 2004
Sold by
Mcfarland Bessie
Bought by
Moore William
Home Financials for this Owner
Home Financials are based on the most recent Mortgage that was taken out on this home.
Original Mortgage
$31,400
Interest Rate
5.8%
Mortgage Type
Stand Alone Second
Create a Home Valuation Report for This Property
The Home Valuation Report is an in-depth analysis detailing your home's value as well as a comparison with similar homes in the area
Home Values in the Area
Average Home Value in this Area
Purchase History
| Date | Buyer | Sale Price | Title Company |
|---|---|---|---|
| Bpdm Properties 2018 1 Llc | $577,500 | First American Title | |
| Chicago Opportunity Properties Llc | $171,000 | Chicago Title Company | |
| Pinewood Estates Llc | -- | None Available | |
| Watson Christine K | $172,000 | Security First Title Co | |
| Moore William | $157,000 | Stewart Title Of Illinois |
Source: Public Records
Mortgage History
| Date | Status | Borrower | Loan Amount |
|---|---|---|---|
| Previous Owner | Watson Christine K | $137,600 | |
| Previous Owner | Moore William | $31,400 | |
| Previous Owner | Moore William | $125,600 |
Source: Public Records
Tax History Compared to Growth
Tax History
| Year | Tax Paid | Tax Assessment Tax Assessment Total Assessment is a certain percentage of the fair market value that is determined by local assessors to be the total taxable value of land and additions on the property. | Land | Improvement |
|---|---|---|---|---|
| 2024 | $2,650 | $10,173 | $2,000 | $8,173 |
| 2023 | $2,880 | $12,560 | $2,600 | $9,960 |
| 2022 | $2,880 | $14,000 | $2,600 | $11,400 |
| 2021 | $2,815 | $14,000 | $2,600 | $11,400 |
| 2020 | $2,358 | $10,585 | $2,600 | $7,985 |
| 2019 | $2,337 | $11,632 | $2,600 | $9,032 |
| 2018 | $2,298 | $11,632 | $2,600 | $9,032 |
| 2017 | $2,311 | $10,734 | $2,400 | $8,334 |
| 2016 | $2,150 | $10,734 | $2,400 | $8,334 |
| 2015 | $1,967 | $10,734 | $2,400 | $8,334 |
| 2014 | $2,105 | $11,343 | $2,200 | $9,143 |
| 2013 | $2,063 | $11,343 | $2,200 | $9,143 |
Source: Public Records
Map
Nearby Homes
- 8029 S Loomis Blvd
- 8144 S Ada St
- 8025 S Loomis Blvd
- 8019 S Ada St
- 8008 S Loomis Blvd
- 8111 S Throop St
- 8011 S Ada St
- 8046 S Laflin St
- 8212 S Bishop St
- 7934 S Loomis Blvd
- 8018 S Laflin St
- 8219 S Throop St
- 8041 S Justine St
- 7918 S Throop St
- 8030 S Justine St
- 8217 S Justine St
- 8247 S Throop St
- 7936 S Laflin St
- 8044 S May St
- 7917 S Elizabeth St
- 8109 S Loomis Blvd
- 8103 S Loomis Blvd Unit 3
- 8103 S Loomis Blvd
- 8103 S Loomis Blvd Unit 2
- 8101 S Loomis Blvd
- 8101 S Loomis Blvd Unit 2
- 8101 S Loomis Blvd Unit 1
- 8101 S Loomis Blvd Unit 3
- 1351 W 81st St
- 1351 W 81st St Unit 1
- 1351 W 81st St Unit 3
- 1349 W 81st St Unit 2
- 1349 W 81st St Unit 1
- 1349 W 81st St
- 1349 W 81st St Unit 3
- 8111 S Loomis Blvd
- 1355 W 81st St
- 8115 S Loomis Blvd
- 8119 S Loomis Blvd
- 8100 S Ada St