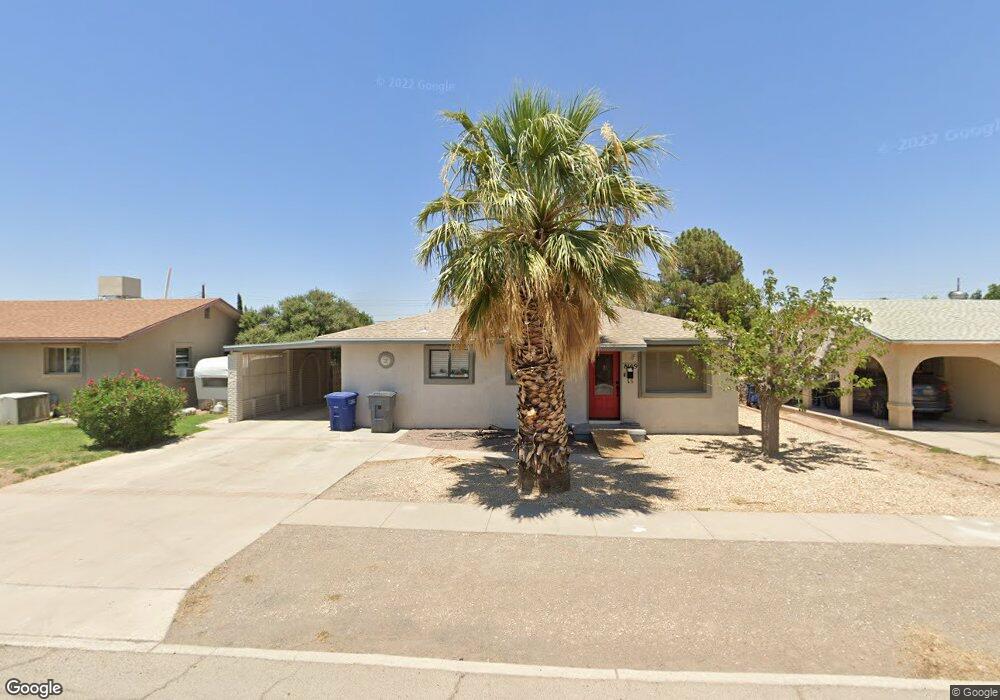
8109 Algerita Ct El Paso, TX 79915
Thomas Manor NeighborhoodEstimated Value: $180,000 - $197,709
3
Beds
2
Baths
1,566
Sq Ft
$118/Sq Ft
Est. Value
About This Home
This home is located at 8109 Algerita Ct, El Paso, TX 79915 and is currently estimated at $185,427, approximately $118 per square foot. 8109 Algerita Ct is a home located in El Paso County with nearby schools including Thomas Manor, Riverside Middle School, and Riverside High School.
Ownership History
Date
Name
Owned For
Owner Type
Purchase Details
Closed on
Sep 4, 2019
Sold by
Sosa Maria E
Bought by
Beltran Monique and Willmott Lee D
Current Estimated Value
Home Financials for this Owner
Home Financials are based on the most recent Mortgage that was taken out on this home.
Original Mortgage
$104,000
Outstanding Balance
$91,096
Interest Rate
3.6%
Mortgage Type
VA
Estimated Equity
$94,331
Purchase Details
Closed on
Mar 28, 2000
Sold by
Garcia Juan M and Gamboa Tomasa
Bought by
Sosa Maria E
Home Financials for this Owner
Home Financials are based on the most recent Mortgage that was taken out on this home.
Original Mortgage
$44,800
Interest Rate
8.37%
Purchase Details
Closed on
May 15, 1996
Sold by
Sosa Maria E and Sosa Maria Elena
Bought by
Garcia Juan M and Gamboa Tomasa
Home Financials for this Owner
Home Financials are based on the most recent Mortgage that was taken out on this home.
Original Mortgage
$35,000
Interest Rate
7.74%
Create a Home Valuation Report for This Property
The Home Valuation Report is an in-depth analysis detailing your home's value as well as a comparison with similar homes in the area
Home Values in the Area
Average Home Value in this Area
Purchase History
| Date | Buyer | Sale Price | Title Company |
|---|---|---|---|
| Beltran Monique | -- | None Available | |
| Sosa Maria E | -- | -- | |
| Garcia Juan M | -- | -- |
Source: Public Records
Mortgage History
| Date | Status | Borrower | Loan Amount |
|---|---|---|---|
| Open | Beltran Monique | $104,000 | |
| Previous Owner | Sosa Maria E | $44,800 | |
| Previous Owner | Garcia Juan M | $35,000 |
Source: Public Records
Tax History Compared to Growth
Tax History
| Year | Tax Paid | Tax Assessment Tax Assessment Total Assessment is a certain percentage of the fair market value that is determined by local assessors to be the total taxable value of land and additions on the property. | Land | Improvement |
|---|---|---|---|---|
| 2025 | $5,356 | $200,500 | $34,632 | $165,868 |
| 2024 | $5,356 | $195,000 | $15,518 | $179,482 |
| 2023 | $5,356 | $195,000 | $15,518 | $179,482 |
| 2022 | $6,924 | $222,959 | $15,518 | $207,441 |
| 2021 | $4,229 | $130,118 | $15,518 | $114,600 |
| 2020 | $3,044 | $96,384 | $15,518 | $80,866 |
| 2018 | $3,058 | $98,321 | $15,518 | $82,803 |
| 2017 | $2,837 | $92,827 | $15,518 | $77,309 |
| 2016 | $2,837 | $92,827 | $15,518 | $77,309 |
| 2015 | $1,368 | $92,827 | $15,518 | $77,309 |
| 2014 | $1,368 | $98,705 | $15,518 | $83,187 |
Source: Public Records
Map
Nearby Homes
- 8141 Lowd Ave
- 8162 Josephine Cir
- 227 Galvan Place
- 8165 Josephine Cir
- 578 Cora Place
- 8250 Mc Elroy Ave
- 7907 Alameda Ave
- 405 Lafayette Dr
- 8138 Saint Andrew Ln Unit ABCD
- 7920 Porche St
- 7925 Broadway Dr
- 7860 Porche St
- 261 Columbia Ave
- 8339 White Rd
- 7952 Broadway Dr
- 7874 Broadway Dr
- 8041 Broadway Dr
- 324 Valley Fair Way
- 7807 Porche St
- 8405 Pinon St
- 8113 Algerita Ct
- 8105 Algerita Ct
- 8117 Algerita Ct
- 8114 Hickory Ln
- 8120 Hickory Ln
- 8101 Algerita Ct
- 8108 Hickory Ln
- 8108 Algerita Ct
- 8104 Algerita Ct
- 8104 Hickory Ln
- 8128 Hickory Ln
- 8112 Algerita Ct
- 8100 Algerita Ct
- 8123 Algerita Ct
- 8116 Algerita Ct
- 8100 Hickory Ln
- 8131 Algerita Ct
- 8120 Algerita Ct
- 8072 Algerita Ct
- 8067 Algerita Ct