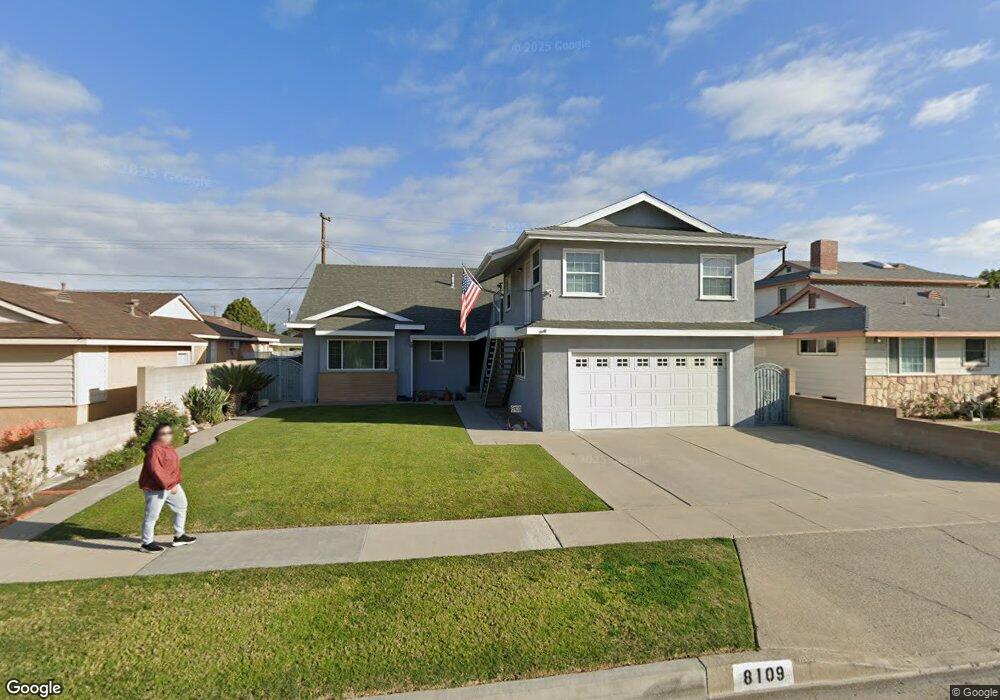
8109 Clover Way Buena Park, CA 90620
Estimated Value: $941,000 - $994,180
3
Beds
2
Baths
2,153
Sq Ft
$446/Sq Ft
Est. Value
About This Home
This home is located at 8109 Clover Way, Buena Park, CA 90620 and is currently estimated at $960,795, approximately $446 per square foot. 8109 Clover Way is a home located in Orange County with nearby schools including Glen H. Dysinger Sr. Elementary School, Brookhurst Junior High School, and Savanna High School.
Ownership History
Date
Name
Owned For
Owner Type
Purchase Details
Closed on
Dec 12, 2014
Sold by
Poston John G and Poston John
Bought by
Poston John G and Poston Kathrine L
Current Estimated Value
Home Financials for this Owner
Home Financials are based on the most recent Mortgage that was taken out on this home.
Original Mortgage
$225,000
Outstanding Balance
$172,348
Interest Rate
3.92%
Mortgage Type
New Conventional
Estimated Equity
$788,447
Purchase Details
Closed on
Dec 13, 2010
Sold by
Poston James
Bought by
Poston John
Purchase Details
Closed on
Nov 2, 2006
Sold by
Poston Rosemary A
Bought by
Poston John and Poston James
Purchase Details
Closed on
Nov 25, 1997
Sold by
Poston Rosemary A
Bought by
Poston Rosemary A and The Rosemary A Poston Living Trust
Create a Home Valuation Report for This Property
The Home Valuation Report is an in-depth analysis detailing your home's value as well as a comparison with similar homes in the area
Home Values in the Area
Average Home Value in this Area
Purchase History
| Date | Buyer | Sale Price | Title Company |
|---|---|---|---|
| Poston John G | -- | First American Title | |
| Poston John | -- | None Available | |
| Poston John | -- | None Available | |
| Poston Rosemary A | -- | None Available | |
| Poston Rosemary A | -- | -- |
Source: Public Records
Mortgage History
| Date | Status | Borrower | Loan Amount |
|---|---|---|---|
| Open | Poston John G | $225,000 |
Source: Public Records
Tax History Compared to Growth
Tax History
| Year | Tax Paid | Tax Assessment Tax Assessment Total Assessment is a certain percentage of the fair market value that is determined by local assessors to be the total taxable value of land and additions on the property. | Land | Improvement |
|---|---|---|---|---|
| 2025 | $3,877 | $321,193 | $225,818 | $95,375 |
| 2024 | $3,877 | $314,896 | $221,391 | $93,505 |
| 2023 | $3,781 | $308,722 | $217,050 | $91,672 |
| 2022 | $3,732 | $302,669 | $212,794 | $89,875 |
| 2021 | $3,679 | $296,735 | $208,622 | $88,113 |
| 2020 | $3,657 | $293,693 | $206,483 | $87,210 |
| 2019 | $3,569 | $287,935 | $202,435 | $85,500 |
| 2018 | $3,506 | $282,290 | $198,466 | $83,824 |
| 2017 | $3,398 | $276,755 | $194,574 | $82,181 |
| 2016 | $3,335 | $271,329 | $190,759 | $80,570 |
| 2015 | $3,297 | $267,254 | $187,894 | $79,360 |
| 2014 | $3,135 | $262,019 | $184,213 | $77,806 |
Source: Public Records
Map
Nearby Homes
- 21 Centerstone Cir
- 8194 Calendula Dr
- 8434 Periwinkle Dr
- 7085 Oregon St
- 7122 Stanton Ave
- 7575 El Escorial Way
- 2697 W Parkside Ln
- 7911 Orangethorpe Ave
- 8054 Teakwood Cir
- 7570 El Chaco Dr
- 7600 Western Ave
- 7451 Western Ave
- 8319 Hickory Dr
- 7430 El Rosal Cir
- 7791 Melrose St
- 8452 Stanton Ave
- 4231 W Hill Ave
- 4260 W Flower Ave
- 7579 Melrose St
- 7650 El Vino Way
- 8121 Clover Way
- 8097 Clover Way
- 8110 Carnation Dr
- 8122 Carnation Dr
- 8098 Carnation Dr
- 8133 Clover Way
- 8110 Clover Way
- 8134 Carnation Dr
- 8122 Clover Way
- 8098 Clover Way
- 8145 Clover Way
- 8075 Clover Way
- 8134 Clover Way
- 8146 Carnation Dr
- 8074 Carnation Dr
- 8146 Clover Way
- 8157 Clover Way
- 8074 Clover Way
- 8061 Clover Way
- 8109 Carnation Dr