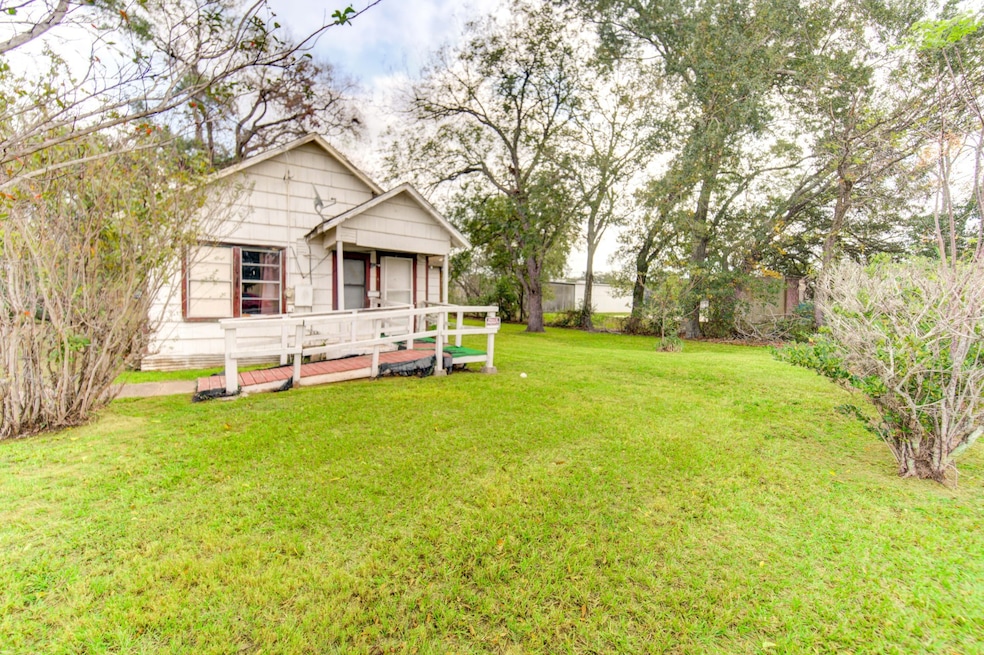
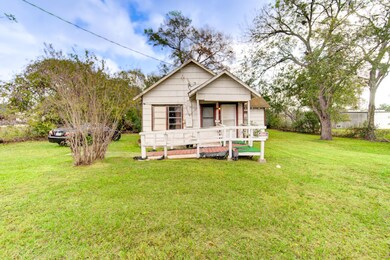
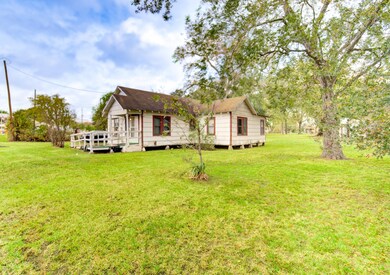
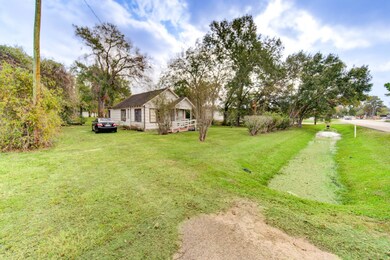
8109 Main St S Fulshear, TX 77441
Estimated payment $3,416/month
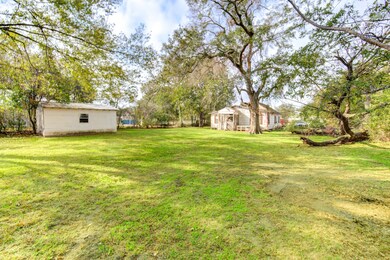
About This Lot
Charming property located at 8109 Main St in Fulshear, TX, . Spacious lot of 15,000 sq.ft. formerly residential is now situated in a commercial area surrounded by other commercial businesses. Take this opprotunity to purchase a lot at an affordable rate for your business.

Property Details
Property Type
- Land
Est. Annual Taxes
- $7,268
Lot Details
- 15,000 Sq Ft Lot
- Open Space
Schools
- Huggins Elementary School
- Leaman Junior High School
- Fulshear High School
Utilities
- Phone Available
- Cable TV Available
Community Details
- Fulshear Subdivision
Map
Home Values in the Area
Average Home Value in this Area
Tax History
| Year | Tax Paid | Tax Assessment Tax Assessment Total Assessment is a certain percentage of the fair market value that is determined by local assessors to be the total taxable value of land and additions on the property. | Land | Improvement |
|---|---|---|---|---|
| 2025 | $6,057 | $491,440 | $422,181 | $69,259 |
| 2024 | $6,057 | $331,072 | $236,605 | $94,467 |
| 2023 | $4,692 | $253,300 | $169,105 | $84,195 |
| 2022 | $454 | $155,140 | $97,500 | $57,640 |
| 2021 | $2,818 | $141,040 | $162,000 | $46,640 |
| 2020 | $2,602 | $128,220 | $162,000 | $45,840 |
| 2019 | $2,467 | $116,560 | $170,100 | $45,840 |
| 2018 | $2,244 | $105,960 | $170,100 | $40,640 |
| 2017 | $2,043 | $96,330 | $170,100 | $37,860 |
| 2016 | $1,857 | $87,570 | $170,100 | $30,120 |
| 2015 | $166 | $79,610 | $129,340 | $60,160 |
| 2014 | $254 | $72,370 | $129,340 | $60,100 |
Property History
| Date | Event | Price | List to Sale | Price per Sq Ft |
|---|---|---|---|---|
| 04/10/2026 04/10/26 | Price Changed | $530,000 | -6.2% | -- |
| 02/27/2026 02/27/26 | Price Changed | $565,000 | -0.9% | -- |
| 02/12/2026 02/12/26 | Price Changed | $570,000 | -0.9% | -- |
| 02/08/2026 02/08/26 | Price Changed | $575,000 | -0.9% | -- |
| 01/25/2026 01/25/26 | Price Changed | $580,000 | -2.8% | -- |
| 01/17/2026 01/17/26 | Price Changed | $597,000 | -0.3% | -- |
| 01/06/2026 01/06/26 | Price Changed | $599,000 | -0.2% | -- |
| 12/24/2025 12/24/25 | Price Changed | $600,000 | -4.0% | -- |
| 11/27/2025 11/27/25 | For Sale | $625,000 | -- | -- |
Purchase History
| Date | Type | Sale Price | Title Company |
|---|---|---|---|
| Warranty Deed | -- | Stewart Title | |
| Deed | -- | -- | |
| Deed | -- | -- |
Source: Houston Association of REALTORS®
MLS Number: 39098834
APN: 3380-00-022-0022-901
Disclaimer: Certain information contained herein is derived from information provided by parties other than Homes.com. All information provided is deemed reliable, but is not guaranteed to be accurate and should be independently verified.
![]() Copyright 2026, Houston REALTORS® Information Service, Inc.
Copyright 2026, Houston REALTORS® Information Service, Inc.
The information provided is exclusively for consumers’ personal, non-commercial use, and may not be used for any purpose other than to identify prospective properties consumers may be interested in purchasing.
Information is deemed reliable but not guaranteed.
- 31430 Bluebell Ave
- 8222 Wallis St
- 8407 Wilson St
- 7971 Fm 359 Rd
- 0 Farm To Market 359
- 0 Fm 359 Main Street Rd S Unit 77310824
- 8418 W First St
- 30614 W Front St
- 7718 Fm 359 Rd S
- tract 14 Dixon Rd
- 7514.5 Dixon Rd
- 7417 Fulshear Katy Rd
- 7514 Hidden Trail
- 7518 Hidden Trail
- 7520 Hidden Trail
- 5422 Lake Hill Farm Way
- 30910 Crest View Terrace
- 0 Fm 1093 Rd Unit 57944305
- 00 Fulshear Katy Rd
- 8023 Royal Palm Dr
- 8223 Wallis St
- 8411 Syms St
- 732 Dream Maker Way
- 886 Glory Place
- 693 Canvas Ave
- 629 Canvas Ave
- 631 Canvas Ave
- 637 Canvas Ave
- 7919 Royal Palm Dr
- 8114 Royal Palm Ct
- 8014 Chukka Dr
- 30247 Gold Finch Place
- 31303 Whitfield Ct
- 31302 Whitfield Ct
- 7926 Grandstand Pkwy
- 7402 Arabian Moon Trail
- 5918 Emerald Ranch Ln
- 31411 Horseshoe Meadow Bend Ln
- 8315 Divot Trace
- 8319 Divot Trace
Ask me questions while you tour the home.