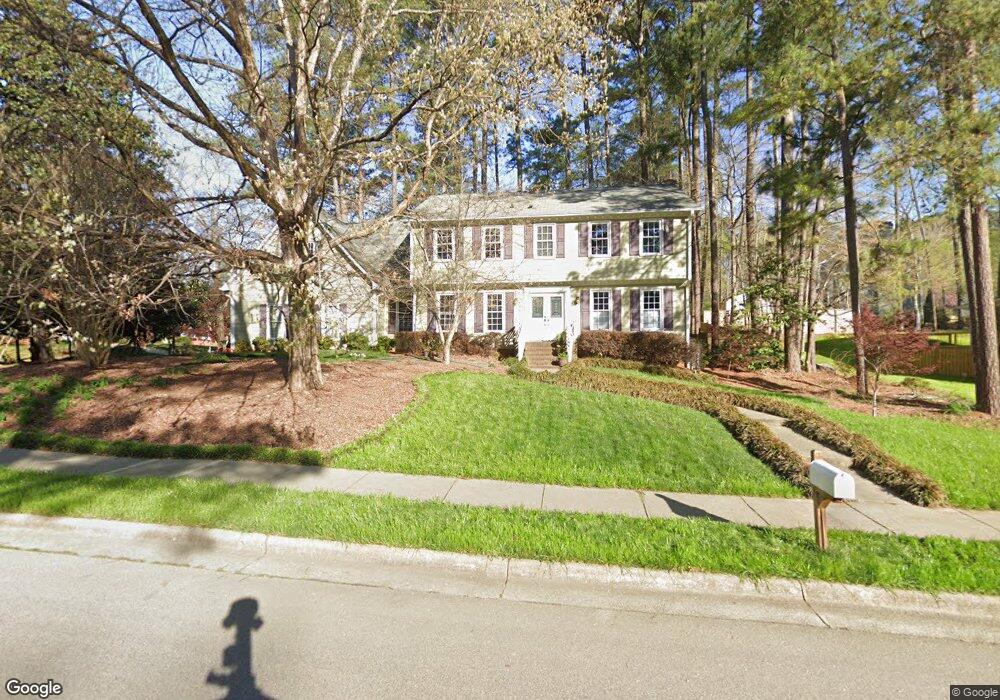
8109 Running Cedar Trail Raleigh, NC 27615
Six Forks NeighborhoodEstimated Value: $604,131 - $716,000
4
Beds
3
Baths
2,780
Sq Ft
$242/Sq Ft
Est. Value
About This Home
This home is located at 8109 Running Cedar Trail, Raleigh, NC 27615 and is currently estimated at $673,283, approximately $242 per square foot. 8109 Running Cedar Trail is a home located in Wake County with nearby schools including North Ridge Elementary School, West Millbrook Middle School, and Sanderson High School.
Ownership History
Date
Name
Owned For
Owner Type
Purchase Details
Closed on
Jun 30, 2008
Sold by
Bourdon David Troy and Bourdon Melinda A
Bought by
Ernhart Alan A and Ernhart Katherine Y
Current Estimated Value
Home Financials for this Owner
Home Financials are based on the most recent Mortgage that was taken out on this home.
Original Mortgage
$263,600
Outstanding Balance
$169,192
Interest Rate
5.97%
Mortgage Type
Purchase Money Mortgage
Estimated Equity
$504,091
Purchase Details
Closed on
Aug 25, 2006
Sold by
Towles Herman E and Towles Dana M
Bought by
Bourdon David Troy and Bourdon Melinda A
Home Financials for this Owner
Home Financials are based on the most recent Mortgage that was taken out on this home.
Original Mortgage
$111,300
Interest Rate
6.28%
Mortgage Type
Purchase Money Mortgage
Create a Home Valuation Report for This Property
The Home Valuation Report is an in-depth analysis detailing your home's value as well as a comparison with similar homes in the area
Home Values in the Area
Average Home Value in this Area
Purchase History
| Date | Buyer | Sale Price | Title Company |
|---|---|---|---|
| Ernhart Alan A | $329,500 | None Available | |
| Bourdon David Troy | $318,000 | None Available |
Source: Public Records
Mortgage History
| Date | Status | Borrower | Loan Amount |
|---|---|---|---|
| Open | Ernhart Alan A | $263,600 | |
| Closed | Ernhart Alan A | $263,600 | |
| Previous Owner | Bourdon David Troy | $111,300 |
Source: Public Records
Tax History Compared to Growth
Tax History
| Year | Tax Paid | Tax Assessment Tax Assessment Total Assessment is a certain percentage of the fair market value that is determined by local assessors to be the total taxable value of land and additions on the property. | Land | Improvement |
|---|---|---|---|---|
| 2025 | $4,913 | $561,018 | $240,000 | $321,018 |
| 2024 | $4,892 | $561,018 | $240,000 | $321,018 |
| 2023 | $4,058 | $370,455 | $125,000 | $245,455 |
| 2022 | $3,771 | $370,455 | $125,000 | $245,455 |
| 2021 | $3,625 | $370,455 | $125,000 | $245,455 |
| 2020 | $3,559 | $370,455 | $125,000 | $245,455 |
| 2019 | $3,767 | $323,316 | $120,000 | $203,316 |
| 2018 | $3,553 | $323,316 | $120,000 | $203,316 |
| 2017 | $3,383 | $323,316 | $120,000 | $203,316 |
| 2016 | $3,314 | $323,316 | $120,000 | $203,316 |
| 2015 | $3,251 | $312,059 | $110,000 | $202,059 |
| 2014 | $3,084 | $312,059 | $110,000 | $202,059 |
Source: Public Records
Map
Nearby Homes
- 8112 Running Cedar Trail
- 8009 Running Cedar Trail
- 8304 Wycombe Ln
- 127 Skylark Way
- 8325 Stryker Ct
- 8716 Mourning Dove Rd
- 8713 Mourning Dove Rd
- 7412 Penny Hill Ln
- 7715 Kingsberry Ct
- 7731 Kingsberry Ct
- 723 Weathergreen Dr
- 8305 Society Place
- 7719 Kelley Ct Unit 314E
- 42 Renwick Ct
- 119 Yorkchester Way
- 7729 Bernadette Ln Unit 322B
- 8039 Brandyapple Dr
- 206 Nouveau Ave
- 204 Bracken Ct
- 136 Yorkchester Way
- 8204 Blue Heron Way
- 8201 Holly Berry Ct
- 8205 Holly Berry Ct
- 8108 Running Cedar Trail
- 8205 Blue Heron Way
- 8208 Blue Heron Way
- 8116 Running Cedar Trail
- 8104 Running Cedar Trail
- 8209 Blue Heron Way
- 8200 Running Cedar Trail
- 8209 Holly Berry Ct
- 8201 Running Cedar Trail
- 8101 Running Cedar Trail
- 8100 Running Cedar Trail
- 8204 Holly Berry Ct
- 8212 Blue Heron Way
- 8204 Oak Leaf Ct
- 8204 Running Cedar Trail
- 2808 Blue Heron Way
- 8213 Blue Heron Way