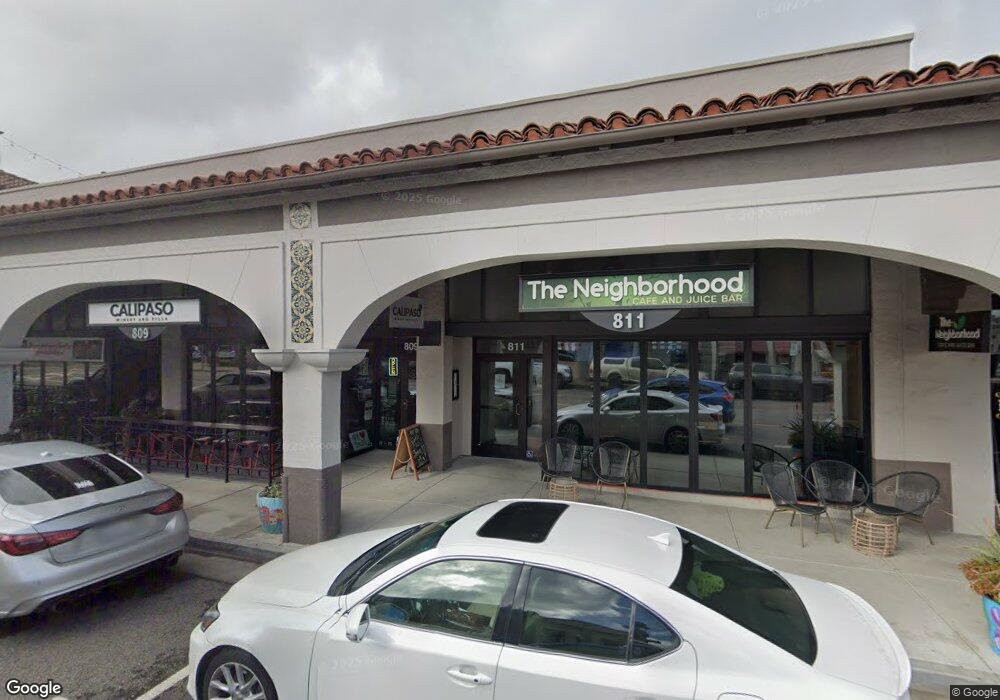
811 13th St Paso Robles, CA 93446
2
Beds
1
Bath
10,996
Sq Ft
15,769
Sq Ft Lot
About This Home
This home is located at 811 13th St, Paso Robles, CA 93446. 811 13th St is a home located in San Luis Obispo County with nearby schools including Glen Speck Elementary School, George H. Flamson Middle School, and Paso Robles High School.
Ownership History
Date
Name
Owned For
Owner Type
Purchase Details
Closed on
Sep 13, 2006
Sold by
Hansen Marcella and Thomson Glen A
Bought by
American Commercial Equities Three Llc L
Purchase Details
Closed on
Jul 5, 2005
Sold by
Hansen Marcella and Robert Hansen Trust
Bought by
Hansen Marcella
Purchase Details
Closed on
Sep 14, 2000
Sold by
Thomson Glen A and Thomson Elizabeth G
Bought by
Thomson Glen A and Thomson Elizabeth G
Purchase Details
Closed on
Jun 5, 2000
Sold by
Hansen Robert F
Bought by
Hansen Robert F and The Robert Hansen Trust
Purchase Details
Closed on
Mar 5, 1999
Sold by
Hansen Marilyn E S
Bought by
Hansen Robert F
Create a Home Valuation Report for This Property
The Home Valuation Report is an in-depth analysis detailing your home's value as well as a comparison with similar homes in the area
Purchase History
| Date | Buyer | Sale Price | Title Company |
|---|---|---|---|
| American Commercial Equities Three Llc L | -- | Chicago Title | |
| Hansen Marcella | -- | -- | |
| Thomson Glen A | -- | -- | |
| Hansen Robert F | -- | -- | |
| Hansen Robert F | -- | -- |
Source: Public Records
Tax History
| Year | Tax Paid | Tax Assessment Tax Assessment Total Assessment is a certain percentage of the fair market value that is determined by local assessors to be the total taxable value of land and additions on the property. | Land | Improvement |
|---|---|---|---|---|
| 2025 | $30,151 | $2,766,262 | $1,548,983 | $1,217,279 |
| 2024 | $29,659 | $2,712,022 | $1,518,611 | $1,193,411 |
| 2023 | $29,659 | $2,658,846 | $1,488,835 | $1,170,011 |
| 2022 | $29,218 | $2,606,713 | $1,459,643 | $1,147,070 |
| 2021 | $28,719 | $2,555,602 | $1,431,023 | $1,124,579 |
| 2020 | $28,329 | $2,529,398 | $1,416,350 | $1,113,048 |
| 2019 | $27,927 | $2,479,803 | $1,388,579 | $1,091,224 |
| 2018 | $27,547 | $2,431,180 | $1,361,352 | $1,069,828 |
| 2017 | $25,903 | $2,383,510 | $1,334,659 | $1,048,851 |
| 2016 | $19,562 | $1,800,000 | $1,200,000 | $600,000 |
| 2015 | $19,785 | $1,800,000 | $1,200,000 | $600,000 |
| 2014 | $19,480 | $1,800,000 | $1,200,000 | $600,000 |
Source: Public Records
Map
Nearby Homes
Your Personal Tour Guide
Ask me questions while you tour the home.