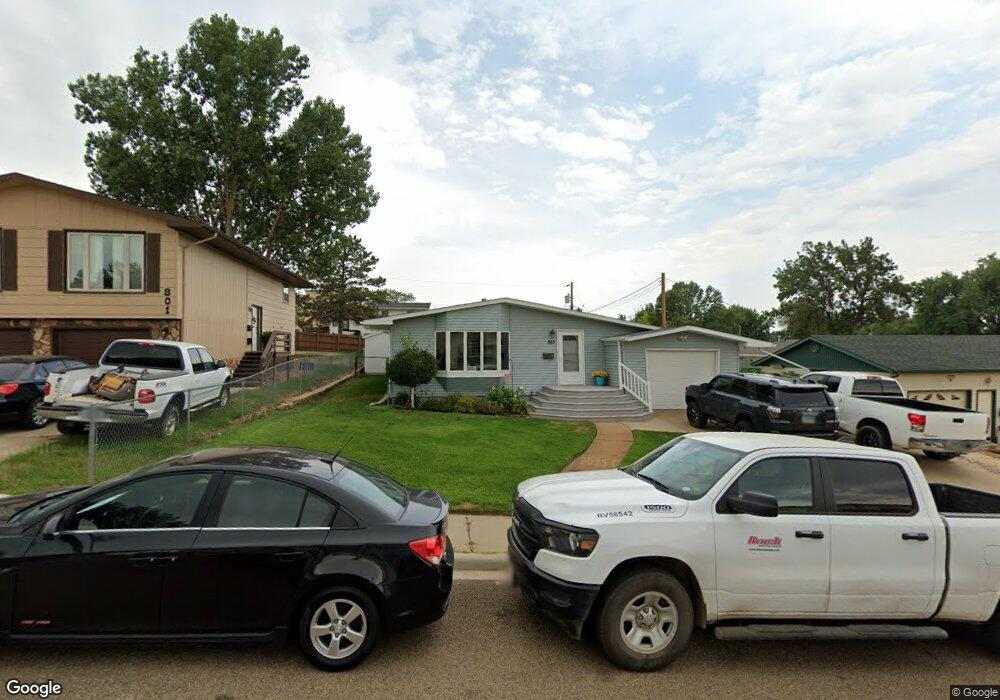
811 2nd Ave E Dickinson, ND 58601
Estimated Value: $281,631 - $305,000
4
Beds
2
Baths
1,196
Sq Ft
$244/Sq Ft
Est. Value
About This Home
This home is located at 811 2nd Ave E, Dickinson, ND 58601 and is currently estimated at $292,210, approximately $244 per square foot. 811 2nd Ave E is a home located in Stark County with nearby schools including Trinity Elementary School East.
Ownership History
Date
Name
Owned For
Owner Type
Purchase Details
Closed on
Apr 5, 2021
Sold by
Dukart Tamra K
Bought by
Dukart Derek R
Current Estimated Value
Home Financials for this Owner
Home Financials are based on the most recent Mortgage that was taken out on this home.
Original Mortgage
$200,000
Outstanding Balance
$178,291
Interest Rate
2.9%
Mortgage Type
New Conventional
Estimated Equity
$113,919
Purchase Details
Closed on
Aug 11, 2011
Sold by
Herauf George E and Herauf Florence
Bought by
Dukart Tamra K
Create a Home Valuation Report for This Property
The Home Valuation Report is an in-depth analysis detailing your home's value as well as a comparison with similar homes in the area
Home Values in the Area
Average Home Value in this Area
Purchase History
| Date | Buyer | Sale Price | Title Company |
|---|---|---|---|
| Dukart Derek R | $250,000 | Queen City Abstract | |
| Dukart Tamra K | -- | None Available |
Source: Public Records
Mortgage History
| Date | Status | Borrower | Loan Amount |
|---|---|---|---|
| Open | Dukart Derek R | $200,000 |
Source: Public Records
Tax History
| Year | Tax Paid | Tax Assessment Tax Assessment Total Assessment is a certain percentage of the fair market value that is determined by local assessors to be the total taxable value of land and additions on the property. | Land | Improvement |
|---|---|---|---|---|
| 2025 | $2,752 | $218,100 | $22,500 | $195,600 |
| 2024 | $2,714 | $218,100 | $22,500 | $195,600 |
| 2023 | $2,152 | $218,100 | $22,500 | $195,600 |
| 2022 | $2,043 | $102,650 | $0 | $0 |
| 2021 | $2,005 | $194,900 | $22,500 | $172,400 |
| 2020 | $2,033 | $194,900 | $22,500 | $172,400 |
| 2019 | $2,038 | $194,900 | $22,500 | $172,400 |
| 2017 | $1,557 | $159,800 | $22,500 | $137,300 |
| 2015 | $1,557 | $177,800 | $21,400 | $156,400 |
| 2014 | $1,640 | $173,400 | $21,400 | $152,000 |
| 2013 | -- | $167,300 | $21,400 | $145,900 |
Source: Public Records
Map
Nearby Homes
Your Personal Tour Guide
Ask me questions while you tour the home.