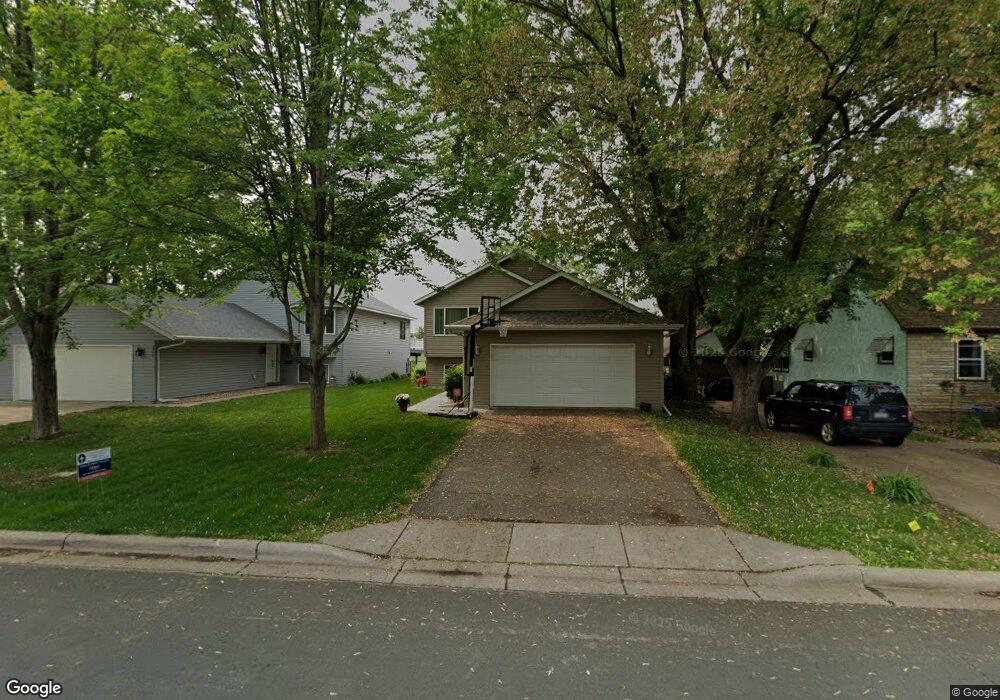
811 7th St W Hastings, MN 55033
Hastings-Marshan Township NeighborhoodEstimated Value: $336,000 - $426,000
3
Beds
2
Baths
1,460
Sq Ft
$266/Sq Ft
Est. Value
About This Home
This home is located at 811 7th St W, Hastings, MN 55033 and is currently estimated at $388,863, approximately $266 per square foot. 811 7th St W is a home located in Dakota County with nearby schools including Hastings Middle School, Christa Mcauliffe Elementary School, and Hastings High School.
Ownership History
Date
Name
Owned For
Owner Type
Purchase Details
Closed on
Mar 20, 2009
Sold by
Austin Don L and Austin Jean M
Bought by
Fransen David M and Fransen Melissa
Current Estimated Value
Home Financials for this Owner
Home Financials are based on the most recent Mortgage that was taken out on this home.
Original Mortgage
$190,486
Outstanding Balance
$120,995
Interest Rate
5.11%
Mortgage Type
FHA
Estimated Equity
$267,868
Purchase Details
Closed on
Jul 5, 2006
Sold by
C & G Homes Inc
Bought by
Austin Jon L and Austin Jean M
Create a Home Valuation Report for This Property
The Home Valuation Report is an in-depth analysis detailing your home's value as well as a comparison with similar homes in the area
Home Values in the Area
Average Home Value in this Area
Purchase History
| Date | Buyer | Sale Price | Title Company |
|---|---|---|---|
| Fransen David M | $194,000 | -- | |
| Austin Jon L | $239,999 | -- |
Source: Public Records
Mortgage History
| Date | Status | Borrower | Loan Amount |
|---|---|---|---|
| Open | Fransen David M | $190,486 |
Source: Public Records
Tax History Compared to Growth
Tax History
| Year | Tax Paid | Tax Assessment Tax Assessment Total Assessment is a certain percentage of the fair market value that is determined by local assessors to be the total taxable value of land and additions on the property. | Land | Improvement |
|---|---|---|---|---|
| 2024 | $4,780 | $403,500 | $54,300 | $349,200 |
| 2023 | $4,780 | $413,800 | $54,400 | $359,400 |
| 2022 | $3,942 | $405,700 | $54,300 | $351,400 |
| 2021 | $3,758 | $326,500 | $47,200 | $279,300 |
| 2020 | $3,856 | $310,600 | $44,900 | $265,700 |
| 2019 | $3,800 | $308,200 | $42,800 | $265,400 |
| 2018 | $3,431 | $289,900 | $40,800 | $249,100 |
| 2017 | $2,872 | $256,500 | $38,800 | $217,700 |
| 2016 | $2,933 | $218,600 | $36,300 | $182,300 |
| 2015 | $2,782 | $199,944 | $32,344 | $167,600 |
| 2014 | -- | $190,461 | $30,908 | $159,553 |
| 2013 | -- | $136,179 | $26,277 | $109,902 |
Source: Public Records
Map
Nearby Homes