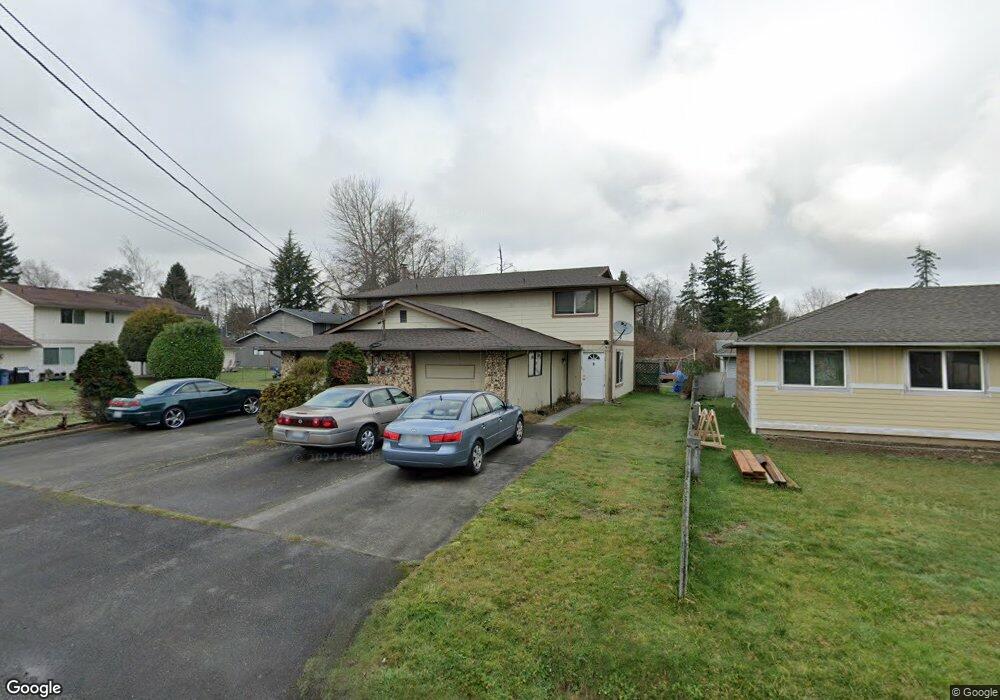
811 93rd St SW Everett, WA 98204
Westmont NeighborhoodEstimated Value: $718,000 - $817,000
4
Beds
4
Baths
1,892
Sq Ft
$396/Sq Ft
Est. Value
About This Home
This home is located at 811 93rd St SW, Everett, WA 98204 and is currently estimated at $748,921, approximately $395 per square foot. 811 93rd St SW is a home located in Snohomish County with nearby schools including Challenger Elementary School, Explorer Middle School, and Mariner High School.
Ownership History
Date
Name
Owned For
Owner Type
Purchase Details
Closed on
Aug 17, 2023
Sold by
Glancy Robert Shawn and Glancy Theresa
Bought by
Robert And Theresa Glancy Trust and Glancy
Current Estimated Value
Purchase Details
Closed on
Jul 17, 1998
Sold by
Glancy Robert S
Bought by
Glancy Robert S and Glancy Theresa A
Home Financials for this Owner
Home Financials are based on the most recent Mortgage that was taken out on this home.
Original Mortgage
$131,200
Interest Rate
6.9%
Purchase Details
Closed on
Jul 6, 1998
Sold by
Glancy Donald L and Glancy Merrilee F
Bought by
Glancy Robert S
Home Financials for this Owner
Home Financials are based on the most recent Mortgage that was taken out on this home.
Original Mortgage
$131,200
Interest Rate
6.9%
Create a Home Valuation Report for This Property
The Home Valuation Report is an in-depth analysis detailing your home's value as well as a comparison with similar homes in the area
Home Values in the Area
Average Home Value in this Area
Purchase History
We collect this data history from publicly available records. To have your information removed, we recommend requesting removal directly through your county’s website.
| Date | Buyer | Sale Price | Title Company |
|---|---|---|---|
| Robert And Theresa Glancy Trust | $313 | None Listed On Document | |
| Glancy Robert S | -- | Commonwealth Land Title Ins | |
| Glancy Robert S | -- | Commonwealth Land Title Ins |
Source: Public Records
Mortgage History
We collect this data history from publicly available records. To have your information removed, we recommend requesting removal directly through your county’s website.
| Date | Status | Borrower | Loan Amount |
|---|---|---|---|
| Previous Owner | Glancy Robert S | $131,200 |
Source: Public Records
Tax History
| Year | Tax Paid | Tax Assessment Tax Assessment Total Assessment is a certain percentage of the fair market value that is determined by local assessors to be the total taxable value of land and additions on the property. | Land | Improvement |
|---|---|---|---|---|
| 2026 | $5,271 | $696,400 | $397,000 | $299,400 |
| 2025 | $4,927 | $656,700 | $371,000 | $285,700 |
| 2024 | $4,927 | $620,700 | $335,000 | $285,700 |
| 2023 | $5,190 | $670,600 | $356,000 | $314,600 |
| 2022 | $4,752 | $531,500 | $261,000 | $270,500 |
| 2020 | $3,849 | $431,700 | $198,000 | $233,700 |
| 2019 | $3,153 | $357,300 | $155,000 | $202,300 |
| 2018 | $3,558 | $348,000 | $158,000 | $190,000 |
| 2017 | $2,747 | $273,900 | $136,000 | $137,900 |
| 2016 | $2,536 | $250,100 | $118,000 | $132,100 |
| 2015 | $2,467 | $220,100 | $101,000 | $119,100 |
| 2013 | $2,062 | $172,200 | $82,000 | $90,200 |
Source: Public Records
Map
Nearby Homes
- 9226 Sharon Dr
- 630 90th St SW Unit A/B
- 712 90th St SW
- 608 91st Place SW
- 8526 8th Ave W Unit A
- 9815 Holly Dr Unit A103
- 9815 Holly Dr Unit A305
- 9815 Holly Dr Unit A208
- 1008 99th St SW
- 1016 99th St SW
- 9745 4th Ave W
- 1427 100th St SW Unit 75
- 1427 100th St SW Unit 160
- 1427 100th St SW Unit 145
- 1427 100th St SW Unit 127
- 1427 100th St SW Unit 67
- 206 W Marilyn Ave
- 1430 W Casino Rd Unit 241
- 10030 Holly Dr Unit 122
- 215 100th St SW Unit B102
- 9207 Sharon Dr
- 9207 Sharon Dr Unit 2
- 9225 Sharon Dr
- 9225 Sharon Dr Unit 1 & 2
- 824 91st Place SW
- 818 91st Place SW
- 805 93rd St SW
- 812 91st Place SW
- 9206 Sharon Dr
- 9129 8th Place W
- 904 91st Place SW
- 9121 8th Place W
- 731 93rd St SW
- 9113 8 St SE
- 804 91st Place SW
- 822 93rd St SW
- 910 91st Place SW
- 727 93rd St SW
- 915 93rd St SW
- 728 91st Place SW
Your Personal Tour Guide
Ask me questions while you tour the home.