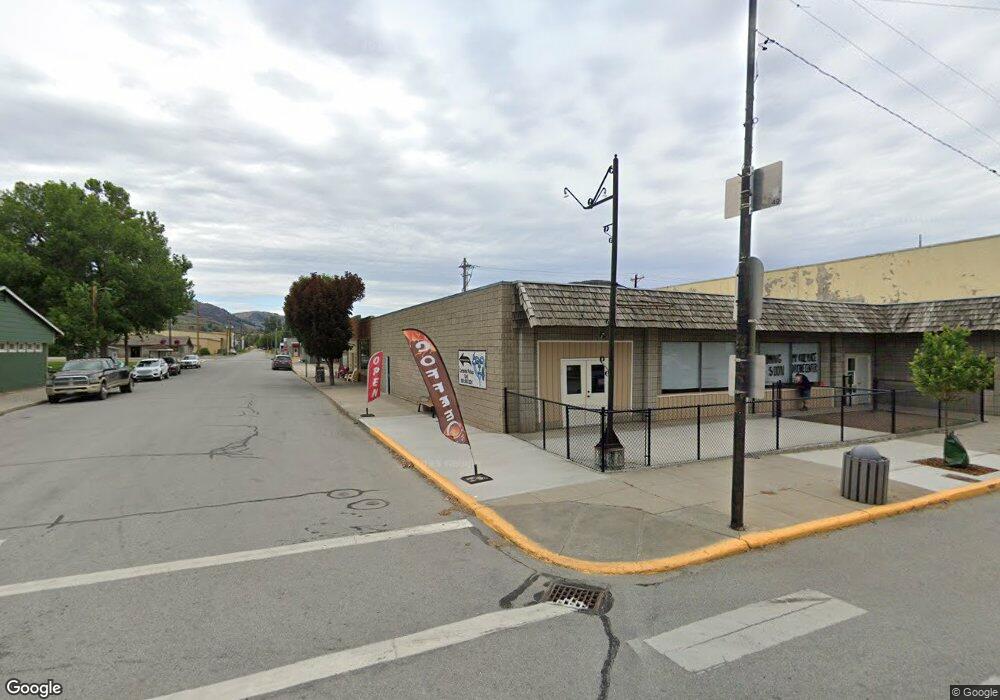
811 Appleway St Oroville, WA 98844
Estimated Value: $235,538
--
Bed
--
Bath
8,835
Sq Ft
$27/Sq Ft
Est. Value
About This Home
This home is located at 811 Appleway St, Oroville, WA 98844 and is currently estimated at $235,538, approximately $26 per square foot. 811 Appleway St is a home located in Okanogan County with nearby schools including Oroville Elementary School and Oroville Middle/High School.
Ownership History
Date
Name
Owned For
Owner Type
Purchase Details
Closed on
Jun 28, 2022
Sold by
Richard Forrester
Bought by
Beside Still Waters Llc
Current Estimated Value
Home Financials for this Owner
Home Financials are based on the most recent Mortgage that was taken out on this home.
Original Mortgage
$150,000
Outstanding Balance
$142,904
Interest Rate
5.25%
Mortgage Type
New Conventional
Estimated Equity
$92,634
Purchase Details
Closed on
May 20, 2010
Sold by
Taylor Kenneth D and Thorson Vivian Taylor
Bought by
Taylor Vivian A and Kenneth D Taylor Special Needs Trust
Create a Home Valuation Report for This Property
The Home Valuation Report is an in-depth analysis detailing your home's value as well as a comparison with similar homes in the area
Home Values in the Area
Average Home Value in this Area
Purchase History
| Date | Buyer | Sale Price | Title Company |
|---|---|---|---|
| Beside Still Waters Llc | -- | Wfg National Title | |
| Taylor Vivian A | -- | None Available |
Source: Public Records
Mortgage History
| Date | Status | Borrower | Loan Amount |
|---|---|---|---|
| Open | Beside Still Waters Llc | $150,000 |
Source: Public Records
Tax History Compared to Growth
Tax History
| Year | Tax Paid | Tax Assessment Tax Assessment Total Assessment is a certain percentage of the fair market value that is determined by local assessors to be the total taxable value of land and additions on the property. | Land | Improvement |
|---|---|---|---|---|
| 2025 | $2,110 | $228,600 | $30,700 | $197,900 |
| 2024 | $2,110 | $228,600 | $30,700 | $197,900 |
| 2022 | $2,704 | $228,600 | $30,700 | $197,900 |
| 2021 | $2,784 | $228,600 | $30,700 | $197,900 |
| 2020 | $2,594 | $228,600 | $30,700 | $197,900 |
| 2019 | $2,306 | $226,500 | $28,800 | $197,700 |
| 2018 | $2,824 | $226,500 | $28,800 | $197,700 |
| 2017 | $2,550 | $226,500 | $28,800 | $197,700 |
| 2016 | $2,469 | $226,500 | $28,800 | $197,700 |
| 2015 | $2,654 | $226,500 | $28,800 | $197,700 |
| 2013 | -- | $226,500 | $28,800 | $197,700 |
Source: Public Records
Map
Nearby Homes