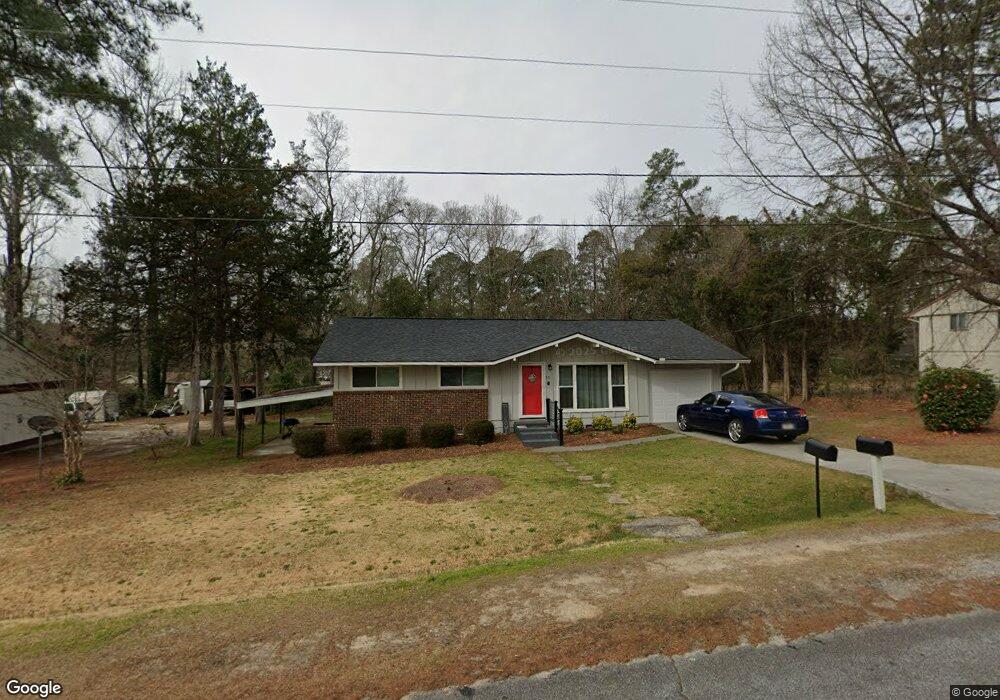
811 Austin St Thomson, GA 30824
Estimated Value: $147,116 - $188,000
3
Beds
2
Baths
1,245
Sq Ft
$135/Sq Ft
Est. Value
About This Home
This home is located at 811 Austin St, Thomson, GA 30824 and is currently estimated at $168,029, approximately $134 per square foot. 811 Austin St is a home located in McDuffie County with nearby schools including Thomson High School.
Ownership History
Date
Name
Owned For
Owner Type
Purchase Details
Closed on
Apr 7, 2021
Sold by
Wilson Eugene
Bought by
Gsq Wilson Inc
Current Estimated Value
Purchase Details
Closed on
Jan 31, 2020
Sold by
Lakeview Loan Servicing Llc
Bought by
Wilson Eugene
Home Financials for this Owner
Home Financials are based on the most recent Mortgage that was taken out on this home.
Original Mortgage
$166,946
Interest Rate
3.72%
Mortgage Type
Commercial
Purchase Details
Closed on
Jul 2, 2019
Sold by
Moore Evelyn
Bought by
Lakeview Loan Servicing Llc
Purchase Details
Closed on
Jan 25, 2016
Sold by
Rogers Bryan P
Bought by
Moore Evelyn
Home Financials for this Owner
Home Financials are based on the most recent Mortgage that was taken out on this home.
Original Mortgage
$56,452
Interest Rate
3.98%
Mortgage Type
New Conventional
Purchase Details
Closed on
Oct 31, 2002
Sold by
Padgett Sherman W
Bought by
Rogers Bryan P
Purchase Details
Closed on
Jul 29, 1994
Bought by
Padgett Sherman W
Create a Home Valuation Report for This Property
The Home Valuation Report is an in-depth analysis detailing your home's value as well as a comparison with similar homes in the area
Home Values in the Area
Average Home Value in this Area
Purchase History
| Date | Buyer | Sale Price | Title Company |
|---|---|---|---|
| Gsq Wilson Inc | -- | -- | |
| Wilson Eugene | $58,000 | -- | |
| Lakeview Loan Servicing Llc | $49,920 | -- | |
| Moore Evelyn | $54,900 | -- | |
| Rogers Bryan P | $57,300 | -- | |
| Padgett Sherman W | $49,500 | -- |
Source: Public Records
Mortgage History
| Date | Status | Borrower | Loan Amount |
|---|---|---|---|
| Previous Owner | Wilson Eugene | $166,946 | |
| Previous Owner | Moore Evelyn | $56,452 |
Source: Public Records
Tax History
| Year | Tax Paid | Tax Assessment Tax Assessment Total Assessment is a certain percentage of the fair market value that is determined by local assessors to be the total taxable value of land and additions on the property. | Land | Improvement |
|---|---|---|---|---|
| 2025 | $1,849 | $59,717 | $2,123 | $57,594 |
| 2024 | $1,849 | $56,577 | $1,833 | $54,744 |
| 2023 | $1,773 | $54,310 | $1,740 | $52,570 |
| 2022 | $1,172 | $34,129 | $1,160 | $32,969 |
| 2021 | $815 | $27,116 | $1,160 | $25,956 |
| 2020 | $1,029 | $29,329 | $5,616 | $23,713 |
| 2019 | $1,038 | $29,329 | $5,616 | $23,713 |
| 2018 | $1,121 | $31,348 | $5,616 | $25,732 |
| 2017 | $764 | $31,348 | $5,616 | $25,732 |
| 2016 | $984 | $31,348 | $5,616 | $25,732 |
| 2015 | $871 | $31,348 | $5,616 | $25,732 |
| 2014 | $874 | $31,348 | $5,616 | $25,732 |
| 2013 | -- | $31,348 | $5,616 | $25,732 |
Source: Public Records
Map
Nearby Homes
- 306 Michael St
- 118 Langham St
- 462 Bussey Ave
- 609 Hillcrest Dr
- 421 Salem Rd
- 0 Wrens Hwy Unit 10652460
- 0 Wrens Hwy Unit 549833
- 426 Salem Rd
- 410 Johns Rd
- 509 Fluker St
- 354 King St
- 403 Fluker St
- 67 Shadowmoor Cir
- 119 Georgia Ave
- 219 White Oak St
- 123 Lee St
- 535 White Oak St
- 318 White Oak St
- 125 Lee St
- 000 Wrens Hwy
Your Personal Tour Guide
Ask me questions while you tour the home.