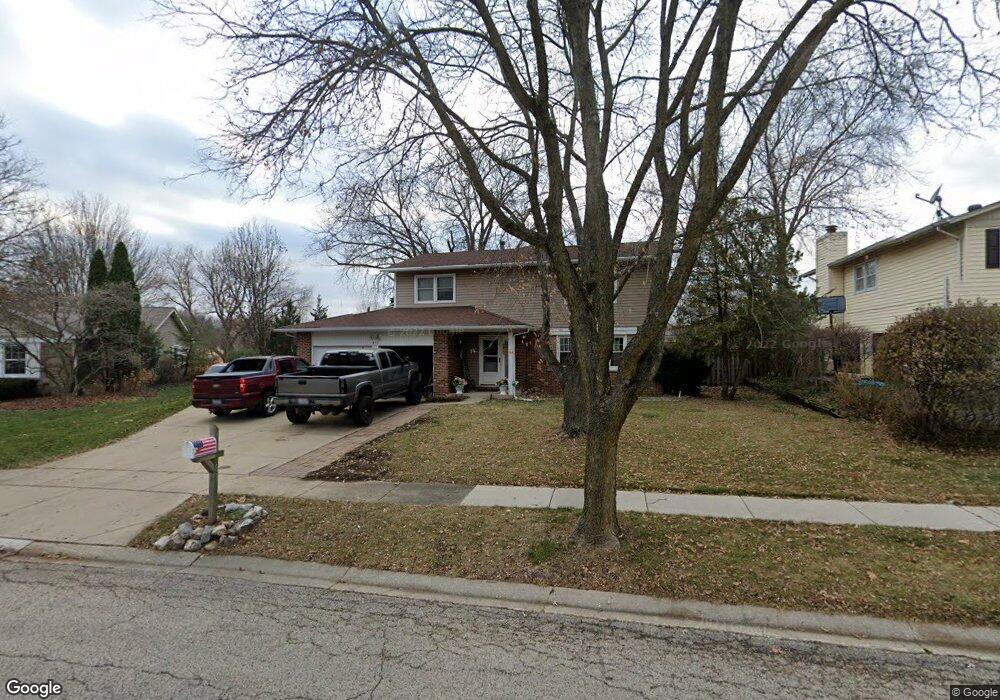
811 Butterfield Dr Algonquin, IL 60102
High Hill Farms NeighborhoodEstimated Value: $355,597 - $421,000
Studio
1
Bath
2,026
Sq Ft
$194/Sq Ft
Est. Value
About This Home
This home is located at 811 Butterfield Dr, Algonquin, IL 60102 and is currently estimated at $393,399, approximately $194 per square foot. 811 Butterfield Dr is a home located in McHenry County with nearby schools including Westfield Community School, Kenneth E Neubert Elementary School, and Harry D Jacobs High School.
Ownership History
Date
Name
Owned For
Owner Type
Purchase Details
Closed on
May 15, 2001
Sold by
Kurowski John and Kurowski Christine R
Bought by
Ferreira Thomas Anthony and Ferreira Michele Lynn
Current Estimated Value
Home Financials for this Owner
Home Financials are based on the most recent Mortgage that was taken out on this home.
Original Mortgage
$152,400
Outstanding Balance
$56,864
Interest Rate
7.02%
Estimated Equity
$336,535
Purchase Details
Closed on
Nov 15, 1999
Sold by
Wisniewski Alexander S and Wisniewski Constance J
Bought by
Kurowski John and Kurowski Christine Russo
Home Financials for this Owner
Home Financials are based on the most recent Mortgage that was taken out on this home.
Original Mortgage
$140,000
Interest Rate
7.72%
Purchase Details
Closed on
Apr 7, 1998
Sold by
Hornsby William J
Bought by
Wisniewski Alexander S and Wisniewski Constance J
Home Financials for this Owner
Home Financials are based on the most recent Mortgage that was taken out on this home.
Original Mortgage
$85,000
Interest Rate
7.18%
Create a Home Valuation Report for This Property
The Home Valuation Report is an in-depth analysis detailing your home's value as well as a comparison with similar homes in the area
Home Values in the Area
Average Home Value in this Area
Purchase History
| Date | Buyer | Sale Price | Title Company |
|---|---|---|---|
| Ferreira Thomas Anthony | $190,500 | Chicago Title Insurance Co | |
| Kurowski John | $175,000 | Universal Title Services Inc | |
| Wisniewski Alexander S | $155,000 | -- |
Source: Public Records
Mortgage History
| Date | Status | Borrower | Loan Amount |
|---|---|---|---|
| Open | Ferreira Thomas Anthony | $152,400 | |
| Previous Owner | Kurowski John | $140,000 | |
| Previous Owner | Wisniewski Alexander S | $85,000 | |
| Closed | Ferreira Thomas Anthony | $28,575 |
Source: Public Records
Tax History
| Year | Tax Paid | Tax Assessment Tax Assessment Total Assessment is a certain percentage of the fair market value that is determined by local assessors to be the total taxable value of land and additions on the property. | Land | Improvement |
|---|---|---|---|---|
| 2024 | $8,106 | $111,628 | $24,165 | $87,463 |
| 2023 | $7,688 | $99,838 | $21,613 | $78,225 |
| 2022 | $7,625 | $94,908 | $21,044 | $73,864 |
| 2021 | $7,313 | $88,418 | $19,605 | $68,813 |
| 2020 | $7,119 | $85,288 | $18,911 | $66,377 |
| 2019 | $6,945 | $81,631 | $18,100 | $63,531 |
| 2018 | $6,616 | $75,410 | $16,721 | $58,689 |
| 2017 | $6,477 | $71,041 | $15,752 | $55,289 |
| 2016 | $6,376 | $66,630 | $14,774 | $51,856 |
| 2013 | -- | $64,654 | $13,783 | $50,871 |
Source: Public Records
Map
Nearby Homes
- 730 Chestnut Ct
- 615 Harper Dr
- 13 Brian Ct
- 909 Roger St
- 1431 Essex St
- 700 Fairfield Ln
- 21 Division St
- 1 N Hubbard St
- SWC Talaga and Algonquin Rd
- 407 La Fox River Dr
- 966 Mesa Dr
- 298 Apache Trail
- 935 Viewpoint Dr
- LOT 3 Blackhawk Dr
- 1033 Interloch Ct Unit 32
- 1820 Crofton Dr
- 939 Mesa Dr
- 135 Arquilla Dr
- 900 Windstone Ct
- 0 River Dr N Unit MRD12473279
- 821 Butterfield Dr
- 801 Butterfield Dr
- 471 Candlewood Ct
- 461 Candlewood Ct
- 831 Butterfield Dr
- 740 Butterfield Dr
- 451 Candlewood Ct
- 761 Butterfield Dr
- 1101 Sandpebble Cir
- 841 Butterfield Dr
- 441 Candlewood Ct
- 730 Butterfield Dr
- 751 Butterfield Dr
- 1111 Sandpebble Cir
- 431 Candlewood Ct
- 711 Brentwood Ct
- 851 Butterfield Dr
- 450 Candlewood Ct
- 741 Butterfield Dr
- 1121 Sandpebble Cir
Your Personal Tour Guide
Ask me questions while you tour the home.