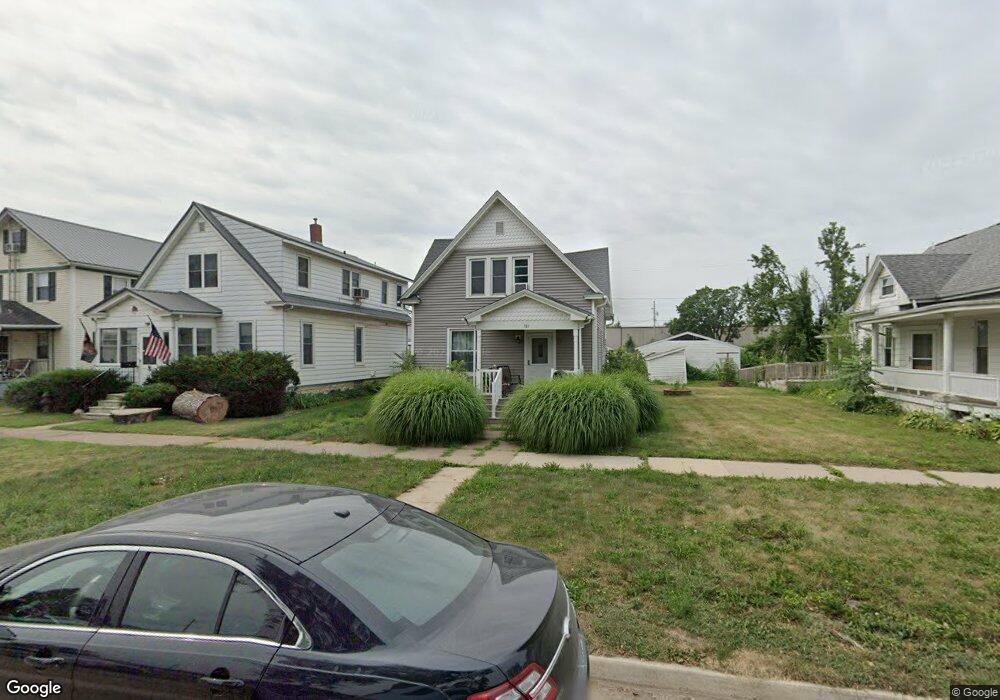
811 C Ave NW Cedar Rapids, IA 52405
Northwest Area NeighborhoodEstimated Value: $146,000 - $158,000
2
Beds
2
Baths
1,436
Sq Ft
$104/Sq Ft
Est. Value
About This Home
This home is located at 811 C Ave NW, Cedar Rapids, IA 52405 and is currently estimated at $149,741, approximately $104 per square foot. 811 C Ave NW is a home located in Linn County with nearby schools including Junction City Elementary School, Harrison Elementary School, and Kentucky Tech - Ashland Reg Tech Center.
Ownership History
Date
Name
Owned For
Owner Type
Purchase Details
Closed on
Aug 7, 2020
Sold by
Jarr Joshua R and Wieditz Jarr Brandis
Bought by
Rouse Justin
Current Estimated Value
Purchase Details
Closed on
Nov 12, 2010
Sold by
Ellison Richard G
Bought by
Rouse Justin D
Home Financials for this Owner
Home Financials are based on the most recent Mortgage that was taken out on this home.
Original Mortgage
$69,018
Interest Rate
4.17%
Mortgage Type
FHA
Create a Home Valuation Report for This Property
The Home Valuation Report is an in-depth analysis detailing your home's value as well as a comparison with similar homes in the area
Home Values in the Area
Average Home Value in this Area
Purchase History
| Date | Buyer | Sale Price | Title Company |
|---|---|---|---|
| Rouse Justin | $47,000 | None Available | |
| Rouse Justin D | -- | None Available |
Source: Public Records
Mortgage History
| Date | Status | Borrower | Loan Amount |
|---|---|---|---|
| Previous Owner | Rouse Justin D | $69,018 |
Source: Public Records
Tax History Compared to Growth
Tax History
| Year | Tax Paid | Tax Assessment Tax Assessment Total Assessment is a certain percentage of the fair market value that is determined by local assessors to be the total taxable value of land and additions on the property. | Land | Improvement |
|---|---|---|---|---|
| 2025 | $1,962 | $129,200 | $27,000 | $102,200 |
| 2024 | $1,964 | $128,400 | $25,000 | $103,400 |
| 2023 | $1,964 | $121,300 | $22,000 | $99,300 |
| 2022 | $1,828 | $102,000 | $22,000 | $80,000 |
| 2021 | $1,750 | $97,200 | $22,000 | $75,200 |
| 2020 | $1,750 | $87,900 | $16,000 | $71,900 |
| 2019 | $1,540 | $83,900 | $12,000 | $71,900 |
| 2018 | $1,426 | $80,000 | $12,000 | $68,000 |
| 2017 | $1,699 | $79,900 | $12,000 | $67,900 |
| 2016 | $1,699 | $79,900 | $12,000 | $67,900 |
| 2015 | $1,749 | $82,222 | $12,000 | $70,222 |
| 2014 | $1,564 | $82,222 | $12,000 | $70,222 |
| 2013 | $1,526 | $82,222 | $12,000 | $70,222 |
Source: Public Records
Map
Nearby Homes
- 217 11th St NW
- 720 E Ave NW
- 1020 A Ave NW
- 714 East Ave NW
- 716 F Ave NW
- 819 G Ave NW
- 810 3rd Ave SW
- 1118 2nd Ave SW
- 816 9th St NW
- 1311 Burch Ave NW
- 1025 3rd Ave SW
- 1073 G Ave NW
- 718 4th St NW
- 1016 H Ave NW
- 531 10th St SW
- 531 9th St SW
- 263 Highland Dr NW
- 290 Highland Dr NW
- 235 Highland Dr NW
- 1400 7th Ave SW