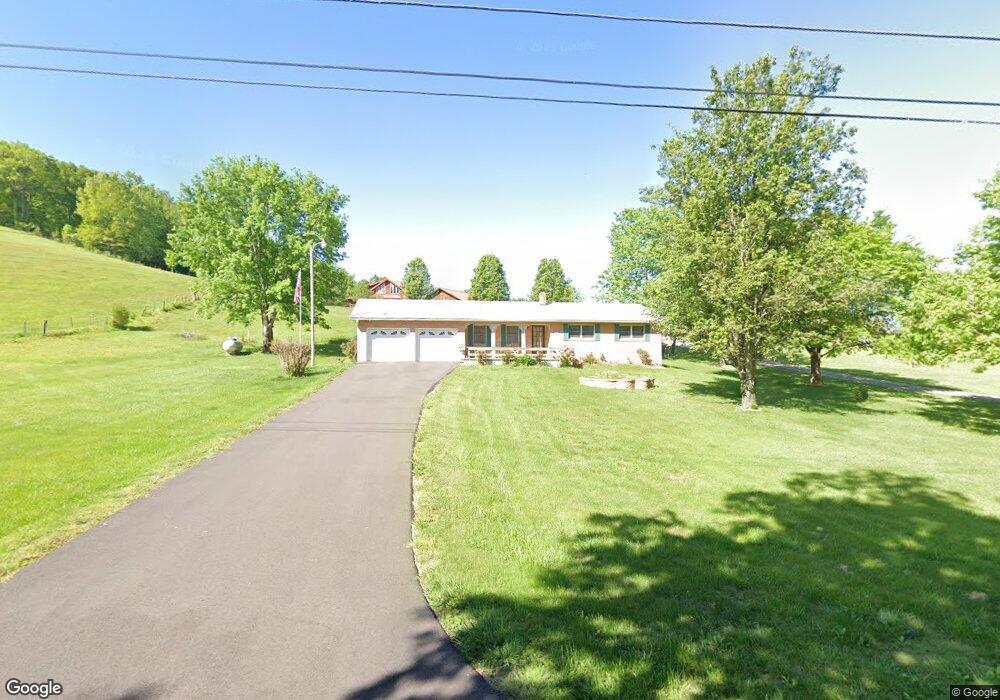
811 Chicken Hollow Rd Newport, TN 37821
Estimated Value: $230,810 - $302,000
--
Bed
2
Baths
1,285
Sq Ft
$204/Sq Ft
Est. Value
About This Home
This home is located at 811 Chicken Hollow Rd, Newport, TN 37821 and is currently estimated at $262,203, approximately $204 per square foot. 811 Chicken Hollow Rd is a home located in Cocke County with nearby schools including Bridgeport Elementary School, Cocke County High School, and Grace Christian School.
Ownership History
Date
Name
Owned For
Owner Type
Purchase Details
Closed on
Nov 10, 2020
Sold by
Goddard Luke and Goddard Melissa
Bought by
Williams Terry M
Current Estimated Value
Home Financials for this Owner
Home Financials are based on the most recent Mortgage that was taken out on this home.
Original Mortgage
$104,000
Outstanding Balance
$92,711
Interest Rate
2.9%
Mortgage Type
New Conventional
Estimated Equity
$169,492
Purchase Details
Closed on
Sep 21, 2020
Sold by
Hendersono Dora and Henderson Richard M
Bought by
Goddard Luke and Goddard Melissa
Home Financials for this Owner
Home Financials are based on the most recent Mortgage that was taken out on this home.
Original Mortgage
$104,000
Outstanding Balance
$92,711
Interest Rate
2.9%
Mortgage Type
New Conventional
Estimated Equity
$169,492
Purchase Details
Closed on
Jul 1, 2007
Sold by
Henderson Richard M
Bought by
Henderson Dora
Purchase Details
Closed on
Oct 17, 2000
Bought by
Henderson Dora and Henderson Richard M Henderson
Create a Home Valuation Report for This Property
The Home Valuation Report is an in-depth analysis detailing your home's value as well as a comparison with similar homes in the area
Home Values in the Area
Average Home Value in this Area
Purchase History
| Date | Buyer | Sale Price | Title Company |
|---|---|---|---|
| Williams Terry M | $130,000 | None Available | |
| Goddard Luke | $85,000 | None Available | |
| Henderson Dora | $1,750 | -- | |
| Henderson Dora | $65,000 | -- |
Source: Public Records
Mortgage History
| Date | Status | Borrower | Loan Amount |
|---|---|---|---|
| Open | Williams Terry M | $104,000 | |
| Previous Owner | Goddard Luke | $60,000 |
Source: Public Records
Tax History Compared to Growth
Tax History
| Year | Tax Paid | Tax Assessment Tax Assessment Total Assessment is a certain percentage of the fair market value that is determined by local assessors to be the total taxable value of land and additions on the property. | Land | Improvement |
|---|---|---|---|---|
| 2024 | $863 | $33,700 | $2,875 | $30,825 |
| 2023 | $863 | $33,700 | $2,875 | $30,825 |
| 2022 | $864 | $33,700 | $2,875 | $30,825 |
| 2021 | $864 | $33,700 | $2,875 | $30,825 |
| 2020 | $819 | $33,700 | $2,875 | $30,825 |
| 2019 | $819 | $28,950 | $2,100 | $26,850 |
| 2018 | $819 | $28,950 | $2,100 | $26,850 |
| 2017 | $840 | $28,950 | $2,100 | $26,850 |
| 2016 | $749 | $28,950 | $2,100 | $26,850 |
| 2015 | $835 | $28,950 | $2,100 | $26,850 |
| 2014 | $835 | $28,950 | $2,100 | $26,850 |
| 2013 | $835 | $34,800 | $2,750 | $32,050 |
Source: Public Records
Map
Nearby Homes
- 815 Video Way
- 11.6 Acres Video Way
- 5 Acres Video Way
- 6.6 Acres Video Way
- 518 Video Way
- 630 Iris Hill Way
- 1390 Wright Rd
- 410 Angel Way
- 408 Angel Way
- Lot 9 Redbud Dr
- 0 11 Acres Hartford Rd Rd
- 1271 Shady Rest Dr
- 1217 Sweetwater Rd
- 1312 Sweetwater Rd
- 1509 Sawmill Rd
- 1271 Sweetwater Rd Unit 1273
- 1976 Hartford Rd
- 1580 Restful Way
- 0 Eagle Mountain Way
- 0 Martin Way
- 810 Chicken Hollow Rd
- 1620 Highway 73
- 817 Highway 73
- 1605 Highway 73
- 825 Chicken Hollow Rd
- 813 Chicken Hollow Rd
- 834 Chicken Hollow Rd
- 797 Day Rd
- 775 Fairday Way
- 786 Shropshire Rd
- 1635 Highway 73
- 837 Chicken Hollow Rd
- 790 Day Rd
- 1642 Highway 73
- 774 Shropshire Rd
- 774 Day Rd
- 1645 Tennessee 73
- 1645 Highway 73
- 780 Shropshire Rd
- 860 Chicken Hollow Rd