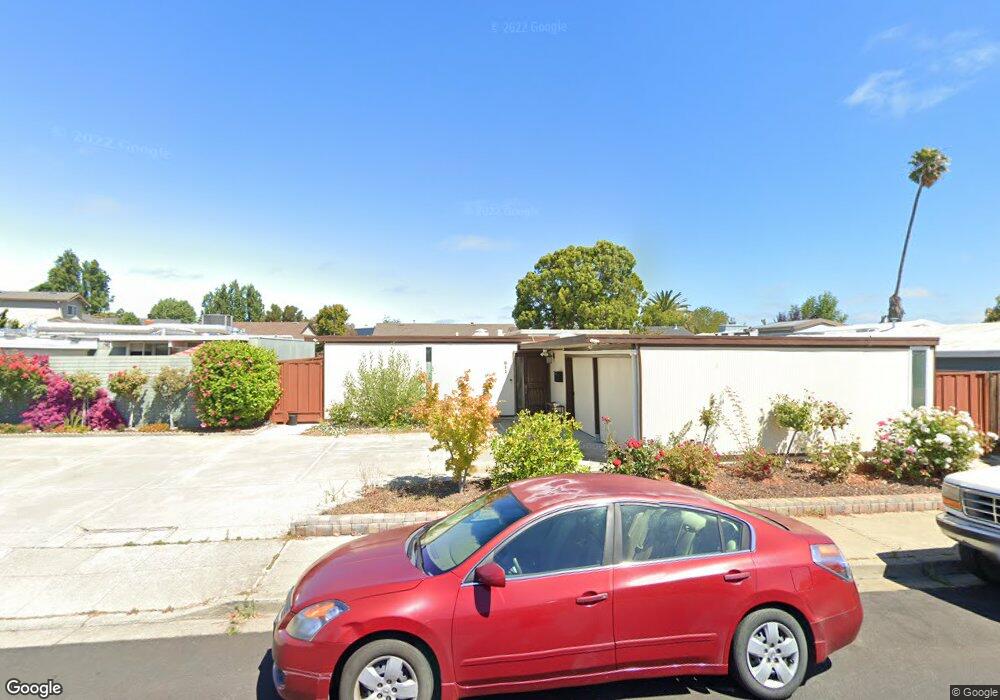
811 Constitution Dr Foster City, CA 94404
Treasure Isle NeighborhoodEstimated Value: $1,934,000 - $2,165,000
4
Beds
2
Baths
1,950
Sq Ft
$1,065/Sq Ft
Est. Value
About This Home
This home is located at 811 Constitution Dr, Foster City, CA 94404 and is currently estimated at $2,075,974, approximately $1,064 per square foot. 811 Constitution Dr is a home located in San Mateo County with nearby schools including Brewer Island Elementary School, Bowditch Middle School, and San Mateo High School.
Ownership History
Date
Name
Owned For
Owner Type
Purchase Details
Closed on
Jun 16, 2011
Sold by
Moore Sherry D
Bought by
Zhao Tong and Xiong Yizhi
Current Estimated Value
Home Financials for this Owner
Home Financials are based on the most recent Mortgage that was taken out on this home.
Original Mortgage
$560,000
Outstanding Balance
$384,781
Interest Rate
4.56%
Mortgage Type
New Conventional
Estimated Equity
$1,691,193
Purchase Details
Closed on
Mar 26, 2011
Sold by
Moore Sherry D
Bought by
Moore Sherry D
Purchase Details
Closed on
Oct 12, 2010
Sold by
Bright William Parker
Bought by
Bright William P
Purchase Details
Closed on
Mar 29, 1996
Sold by
Moore Sherry D
Bought by
Bright William Parker
Home Financials for this Owner
Home Financials are based on the most recent Mortgage that was taken out on this home.
Original Mortgage
$255,000
Interest Rate
7.34%
Create a Home Valuation Report for This Property
The Home Valuation Report is an in-depth analysis detailing your home's value as well as a comparison with similar homes in the area
Home Values in the Area
Average Home Value in this Area
Purchase History
| Date | Buyer | Sale Price | Title Company |
|---|---|---|---|
| Zhao Tong | $700,000 | First American Title Company | |
| Moore Sherry D | -- | None Available | |
| Bright William P | -- | None Available | |
| Bright William Parker | $73,000 | Fidelity National Title Ins |
Source: Public Records
Mortgage History
| Date | Status | Borrower | Loan Amount |
|---|---|---|---|
| Open | Zhao Tong | $560,000 | |
| Previous Owner | Bright William Parker | $255,000 |
Source: Public Records
Tax History Compared to Growth
Tax History
| Year | Tax Paid | Tax Assessment Tax Assessment Total Assessment is a certain percentage of the fair market value that is determined by local assessors to be the total taxable value of land and additions on the property. | Land | Improvement |
|---|---|---|---|---|
| 2025 | $10,558 | $896,810 | $448,405 | $448,405 |
| 2023 | $10,558 | $861,988 | $430,994 | $430,994 |
| 2022 | $10,196 | $845,088 | $422,544 | $422,544 |
| 2021 | $10,060 | $828,518 | $414,259 | $414,259 |
| 2020 | $9,784 | $820,024 | $410,012 | $410,012 |
| 2019 | $9,274 | $803,946 | $401,973 | $401,973 |
| 2018 | $8,815 | $788,184 | $394,092 | $394,092 |
| 2017 | $8,715 | $772,730 | $386,365 | $386,365 |
| 2016 | $8,737 | $757,580 | $378,790 | $378,790 |
| 2015 | $8,534 | $746,202 | $373,101 | $373,101 |
| 2014 | $8,316 | $731,586 | $365,793 | $365,793 |
Source: Public Records
Map
Nearby Homes
- 650 Pilgrim Dr
- 3206 Admiralty Ln
- 1102 Admiralty Ln
- 1074 Eagle Ln
- 1028 Foster Square Ln Unit 305
- 769 Eppleton Ln Unit 302
- 708 Thayer Ln Unit 404
- 1336 Marlin Ave
- 1351 Marlin Ave
- 591 Pilgrim Dr
- 708 Eppleton Ln Unit 204
- 718 Eppleton Ln Unit 303
- 224 Loon Ct
- 1018 Lido Ln
- 241 Bonita Ln
- 825 Cortez Ln
- 822 Magellan Ln
- 986 Cartier Ln
- 275 Puffin Ct
- 851 Cabot Ln
- 815 Constitution Dr
- 809 Constitution Dr
- 1142 Polynesia Dr
- 819 Constitution Dr
- 1144 Polynesia Dr
- 1140 Polynesia Dr
- 805 Constitution Dr
- 808 Constitution Dr
- 1146 Polynesia Dr
- 816 Constitution Dr
- 1138 Polynesia Dr
- 825 Constitution Dr
- 820 Constitution Dr
- 827 Chrysopolis Dr
- 1150 Polynesia Dr
- 801 Constitution Dr
- 1136 Polynesia Dr
- 826 Constitution Dr
- 833 Chrysopolis Dr
- 829 Constitution Dr