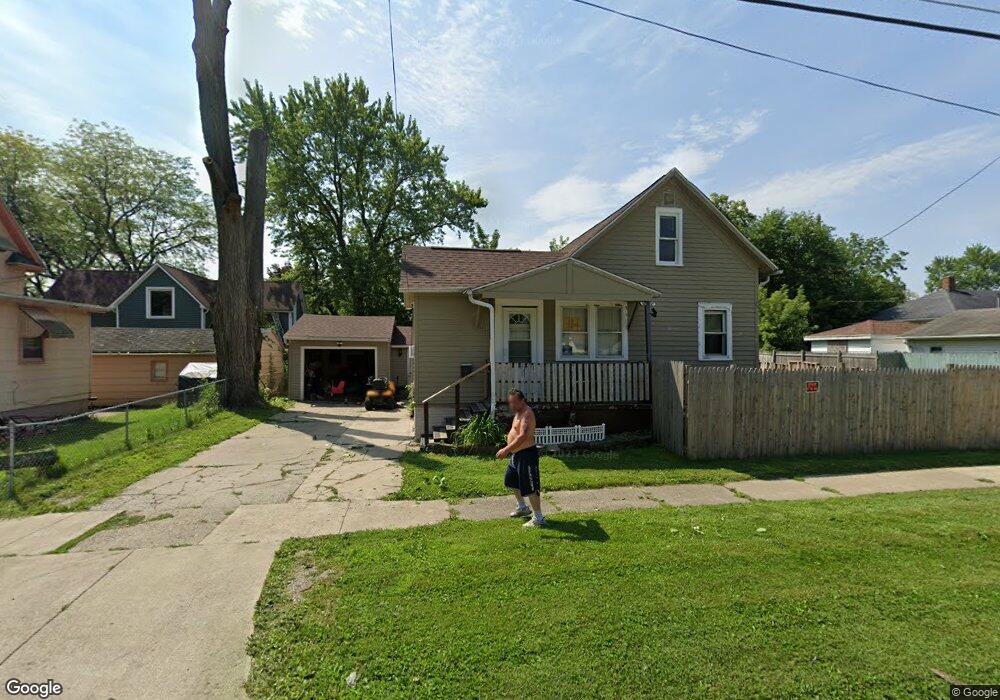
811 Cronk Ave Saginaw, MI 48602
Northmoor NeighborhoodEstimated Value: $47,000 - $61,000
--
Bed
--
Bath
1,253
Sq Ft
$43/Sq Ft
Est. Value
About This Home
This home is located at 811 Cronk Ave, Saginaw, MI 48602 and is currently estimated at $53,659, approximately $42 per square foot. 811 Cronk Ave is a home located in Saginaw County with nearby schools including Stone School, Thompson Middle School, and Arthur Hill High School.
Ownership History
Date
Name
Owned For
Owner Type
Purchase Details
Closed on
Mar 24, 2022
Sold by
Crecencio Moncada
Bought by
Armstrong Wendy
Current Estimated Value
Purchase Details
Closed on
Mar 10, 2022
Sold by
Jason Lemmer
Bought by
Moncada Crecencio
Purchase Details
Closed on
Aug 26, 2021
Sold by
Elizabeth Christian Morgan
Bought by
Webb Jason
Purchase Details
Closed on
Aug 25, 2021
Sold by
Jason Webb
Bought by
Gries Scott
Purchase Details
Closed on
Feb 4, 2021
Sold by
Scott Gries
Bought by
Lemmer Jason
Purchase Details
Closed on
Feb 17, 2011
Sold by
Graves Timothy J and Graves Karen L
Bought by
Christian Morgan Elizabeth
Purchase Details
Closed on
Apr 7, 1995
Sold by
Grymes Nelma and Grymes William
Bought by
Graves Timothy J and Graves Karen L
Purchase Details
Closed on
Apr 1, 1995
Purchase Details
Closed on
Dec 27, 1989
Sold by
Mchenry Michael and Mchenry Joann L
Bought by
Grymes Wm H and Grymes Nelma L
Create a Home Valuation Report for This Property
The Home Valuation Report is an in-depth analysis detailing your home's value as well as a comparison with similar homes in the area
Home Values in the Area
Average Home Value in this Area
Purchase History
| Date | Buyer | Sale Price | Title Company |
|---|---|---|---|
| Armstrong Wendy | -- | None Listed On Document | |
| Moncada Crecencio | -- | None Listed On Document | |
| Webb Jason | $4,500 | None Listed On Document | |
| Gries Scott | -- | None Listed On Document | |
| Lemmer Jason | -- | None Listed On Document | |
| Christian Morgan Elizabeth | $3,000 | -- | |
| Graves Timothy J | -- | -- | |
| -- | -- | -- | |
| Grymes Wm H | $21,000 | -- |
Source: Public Records
Tax History Compared to Growth
Tax History
| Year | Tax Paid | Tax Assessment Tax Assessment Total Assessment is a certain percentage of the fair market value that is determined by local assessors to be the total taxable value of land and additions on the property. | Land | Improvement |
|---|---|---|---|---|
| 2025 | $1,296 | $20,400 | $0 | $0 |
| 2024 | $1,060 | $18,300 | $0 | $0 |
| 2023 | $1,017 | $16,500 | $0 | $0 |
| 2022 | $1,150 | $15,200 | $0 | $0 |
| 2021 | $866 | $13,700 | $0 | $0 |
| 2020 | $1,385 | $12,400 | $0 | $0 |
| 2019 | $783 | $11,400 | $400 | $11,000 |
| 2018 | $737 | $11,910 | $0 | $0 |
| 2017 | $996 | $11,150 | $0 | $0 |
| 2016 | $728 | $11,264 | $0 | $0 |
| 2014 | -- | $11,393 | $0 | $11,159 |
| 2013 | -- | $11,513 | $0 | $0 |
Source: Public Records
Map
Nearby Homes
- 2023 Schaefer St
- 815 W Genesee Ave
- 2440 Hermansau St
- 1920 Hanchett St
- 2206 N Bond St
- 2021 Benjamin St
- 814 Ash St
- 2343 N Bond St
- 1826 Stone St
- 1819 Stark St
- 2535 Schaefer St
- 2459 Benjamin St
- 1020 Reed St
- 2463 Benjamin St
- 1833 N Bond St
- 2626 Hermansau St
- 2450 N Mason St
- 1720 N Oakley St
- 1616 State St
- 2104 Delaware Blvd
- 815 Cronk Ave
- 2221 Hanchett St
- 2220 Stark St
- 2215 Hanchett St
- 2216 Stark St
- 2214 Stark St
- 2303 Hanchett St
- 2209 Hanchett St
- 2302 Stark St
- 2210 Stark St
- 812 Davenport Ave
- 808 Davenport Ave
- 2206 Stark St
- 2304 Stark St
- 721 Cronk Ave
- 2309 Hanchett St
- 2203 Hanchett St
- 2310 Stark St
- 2214 Hanchett St
- 2202 Stark St