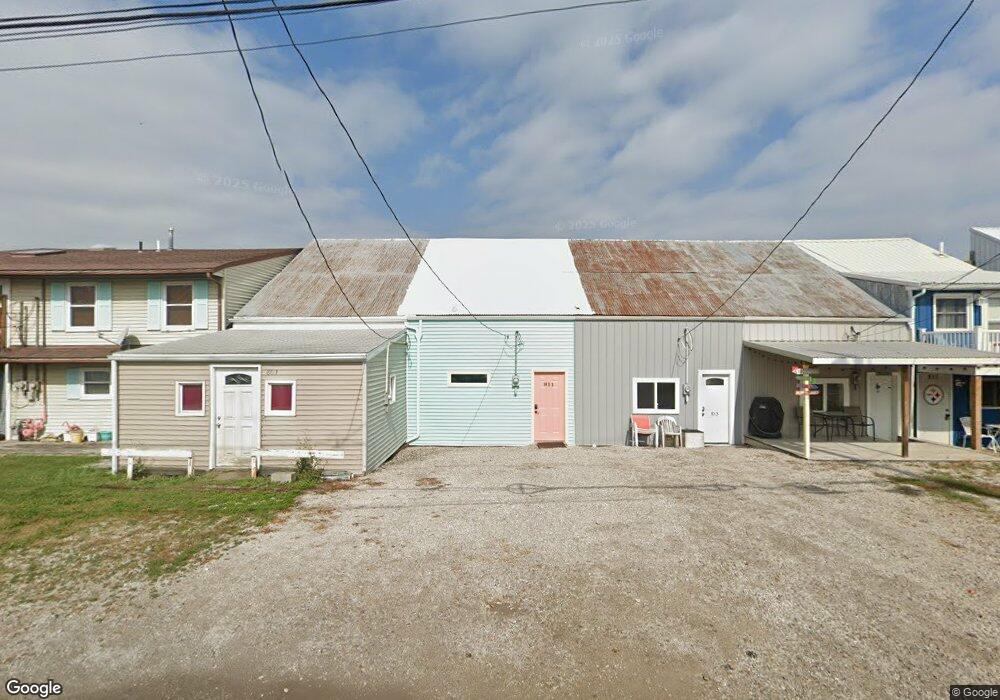
811 Curran St Sandusky, OH 44870
Estimated Value: $95,000 - $121,000
--
Bed
--
Bath
--
Sq Ft
2,004
Sq Ft Lot
About This Home
This home is located at 811 Curran St, Sandusky, OH 44870 and is currently estimated at $110,283. 811 Curran St is a home located in Erie County with nearby schools including Sandusky High School, Monroe Preparatory Academy, and Sandusky Central Catholic School.
Ownership History
Date
Name
Owned For
Owner Type
Purchase Details
Closed on
Jul 13, 2021
Sold by
Fuller Angela K
Bought by
Moyer Kevin L
Current Estimated Value
Purchase Details
Closed on
Apr 16, 2021
Sold by
Fuller Edward C
Bought by
Angela K Fuller
Purchase Details
Closed on
Mar 19, 2009
Sold by
Pusateri Thos A and Pusateri Trudy C
Bought by
Fuller Edward C and Fuller Angela K
Purchase Details
Closed on
Jun 4, 2007
Sold by
Pusateri Thomas A and Pusateri Trudy C
Bought by
Pusateri Todd A
Purchase Details
Closed on
Jan 9, 1997
Sold by
Bishop Julee
Bought by
Steven and Brown Elaine
Create a Home Valuation Report for This Property
The Home Valuation Report is an in-depth analysis detailing your home's value as well as a comparison with similar homes in the area
Home Values in the Area
Average Home Value in this Area
Purchase History
| Date | Buyer | Sale Price | Title Company |
|---|---|---|---|
| Moyer Kevin L | $35,000 | None Available | |
| Angela K Fuller | -- | -- | |
| Fuller Edward C | $55,000 | Hartung Title | |
| Pusateri Todd A | -- | None Available | |
| Steven | $18,000 | -- |
Source: Public Records
Mortgage History
| Date | Status | Borrower | Loan Amount |
|---|---|---|---|
| Closed | Pusateri Todd A | $0 |
Source: Public Records
Tax History Compared to Growth
Tax History
| Year | Tax Paid | Tax Assessment Tax Assessment Total Assessment is a certain percentage of the fair market value that is determined by local assessors to be the total taxable value of land and additions on the property. | Land | Improvement |
|---|---|---|---|---|
| 2024 | $819 | $20,796 | $16,586 | $4,210 |
| 2023 | $819 | $13,023 | $10,846 | $2,177 |
| 2022 | $660 | $13,023 | $10,846 | $2,177 |
| 2021 | $667 | $13,030 | $10,850 | $2,180 |
| 2020 | $725 | $13,030 | $10,850 | $2,180 |
| 2019 | $746 | $13,030 | $10,850 | $2,180 |
| 2018 | $746 | $13,030 | $10,850 | $2,180 |
| 2017 | $512 | $8,900 | $6,490 | $2,410 |
| 2016 | $497 | $8,650 | $6,490 | $2,160 |
| 2015 | $450 | $8,650 | $6,490 | $2,160 |
| 2014 | $457 | $8,840 | $6,490 | $2,350 |
| 2013 | $226 | $8,840 | $6,490 | $2,350 |
Source: Public Records
Map
Nearby Homes