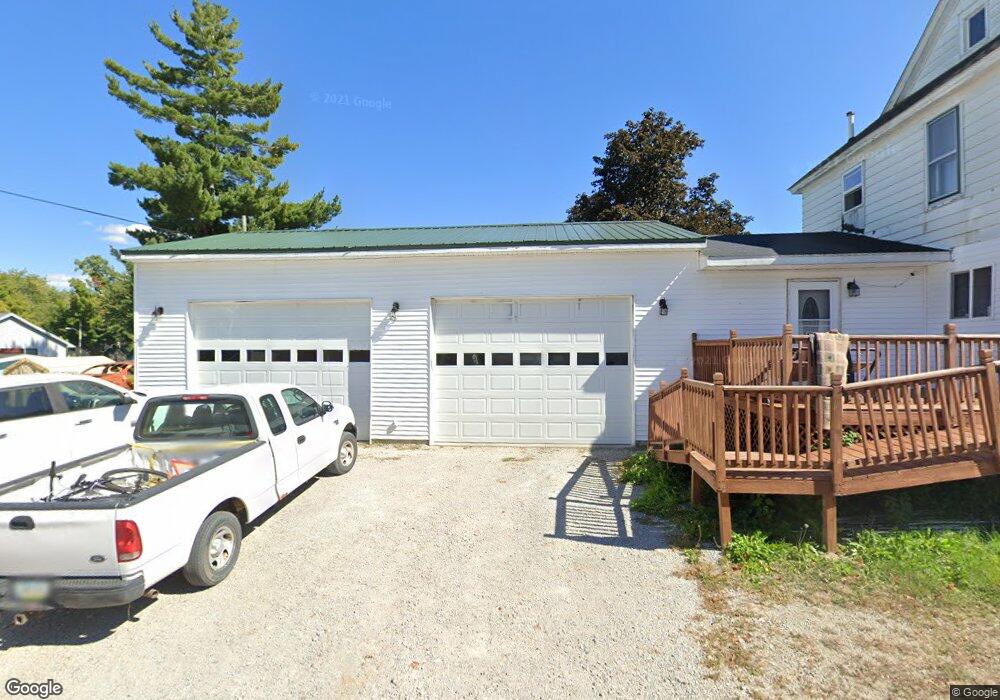
811 E 4th St Vinton, IA 52349
Estimated Value: $193,403 - $229,000
4
Beds
2
Baths
1,985
Sq Ft
$107/Sq Ft
Est. Value
About This Home
This home is located at 811 E 4th St, Vinton, IA 52349 and is currently estimated at $213,101, approximately $107 per square foot. 811 E 4th St is a home located in Benton County with nearby schools including Tilford Elementary School, Vinton-Shellsburg Middle School, and Vinton-Shellsburg High School.
Ownership History
Date
Name
Owned For
Owner Type
Purchase Details
Closed on
Feb 7, 2025
Sold by
Lerch Jeremy
Bought by
Hennigan Crystal L
Current Estimated Value
Purchase Details
Closed on
Sep 27, 2023
Sold by
Miedke Steven C
Bought by
Digman Thomas G and Digman Lori A
Purchase Details
Closed on
Sep 26, 2014
Sold by
Barkdoll Linda and Barkdoll Phillip
Bought by
Lerch Jeremy and Hennigan Crystal L
Home Financials for this Owner
Home Financials are based on the most recent Mortgage that was taken out on this home.
Original Mortgage
$88,369
Interest Rate
4.11%
Mortgage Type
FHA
Create a Home Valuation Report for This Property
The Home Valuation Report is an in-depth analysis detailing your home's value as well as a comparison with similar homes in the area
Home Values in the Area
Average Home Value in this Area
Purchase History
| Date | Buyer | Sale Price | Title Company |
|---|---|---|---|
| Hennigan Crystal L | -- | None Listed On Document | |
| Digman Thomas G | $46,000 | None Listed On Document | |
| Lerch Jeremy | $90,000 | None Available |
Source: Public Records
Mortgage History
| Date | Status | Borrower | Loan Amount |
|---|---|---|---|
| Previous Owner | Lerch Jeremy | $88,369 |
Source: Public Records
Tax History
| Year | Tax Paid | Tax Assessment Tax Assessment Total Assessment is a certain percentage of the fair market value that is determined by local assessors to be the total taxable value of land and additions on the property. | Land | Improvement |
|---|---|---|---|---|
| 2025 | $2,264 | $193,800 | $16,000 | $177,800 |
| 2024 | $2,264 | $174,200 | $15,300 | $158,900 |
| 2023 | $2,790 | $174,200 | $15,300 | $158,900 |
| 2022 | $2,862 | $138,500 | $12,200 | $126,300 |
| 2021 | $2,862 | $138,500 | $12,200 | $126,300 |
| 2020 | $2,710 | $134,000 | $12,900 | $121,100 |
| 2019 | $2,698 | $134,000 | $12,900 | $121,100 |
| 2018 | $2,616 | $128,700 | $12,400 | $116,300 |
| 2017 | $2,616 | $131,600 | $12,400 | $119,200 |
| 2016 | $1,974 | $104,300 | $11,600 | $92,700 |
| 2015 | $1,974 | $91,500 | $11,600 | $79,900 |
| 2014 | $1,972 | $91,200 | $0 | $0 |
Source: Public Records
Map
Nearby Homes