811 E Clay Ave Brandon, FL 33510
Estimated Value: $355,000 - $425,000
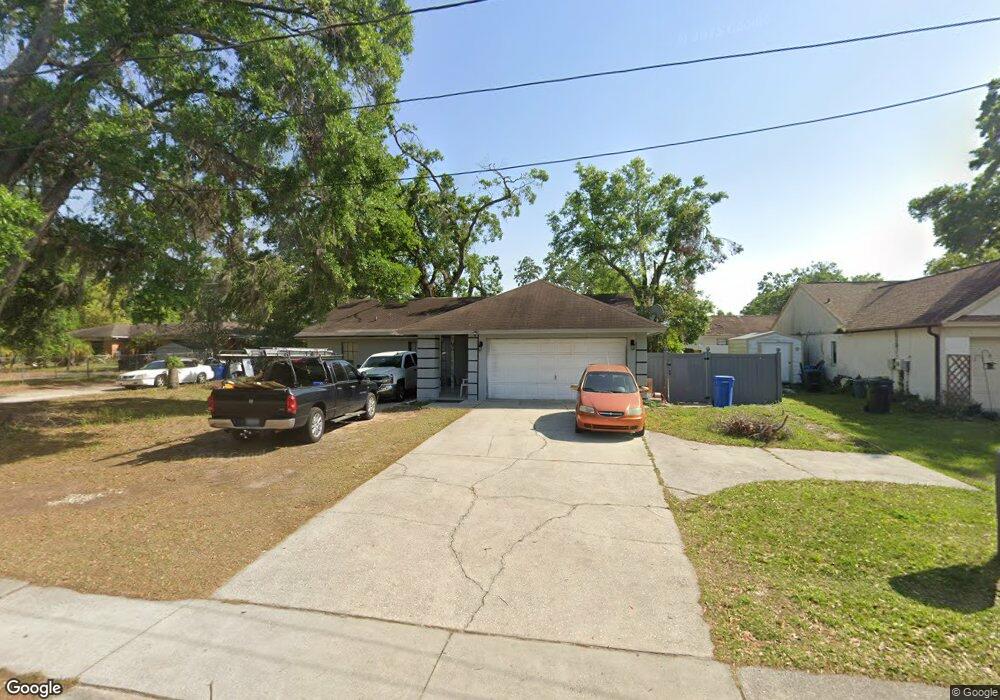
About This Home
This home is located at 811 E Clay Ave, Brandon, FL 33510 and is currently estimated at $389,350, approximately $163 per square foot. 811 E Clay Ave is a home located in Hillsborough County with nearby schools including Yates Elementary School, Mann Middle School, and Brandon High School.
Ownership History
We collect this data history from publicly available records. To have your information removed, we recommend requesting removal directly through your county’s website.
Purchase Details
Purchase Details
Purchase Details
Purchase Details
Purchase Details
Purchase Details
Home Financials for this Owner
Home Financials are based on the most recent Mortgage that was taken out on this home.Home Values in the Area
Average Home Value in this Area
Purchase History
We collect this data history from publicly available records. To have your information removed, we recommend requesting removal directly through your county’s website.
| Date | Buyer | Sale Price | Title Company |
|---|---|---|---|
| -- | None Listed On Document | ||
| -- | None Available | ||
| -- | -- | ||
| -- | -- | ||
| $164,500 | Carrollwood Title Inc | ||
| $91,500 | -- |
Mortgage History
We collect this data history from publicly available records. To have your information removed, we recommend requesting removal directly through your county’s website.
| Date | Status | Borrower | Loan Amount |
|---|---|---|---|
| Previous Owner | $89,942 |
Tax History
We collect this data history from publicly available records. To have your information removed, we recommend requesting removal directly through your county’s website.
| Year | Tax Paid | Tax Assessment Tax Assessment Total Assessment is a certain percentage of the fair market value that is determined by local assessors to be the total taxable value of land and additions on the property. | Land | Improvement |
|---|---|---|---|---|
| 2025 | $4,991 | $306,413 | -- | -- |
| 2024 | $4,991 | $297,777 | -- | -- |
| 2023 | $4,813 | $289,104 | $105,708 | $183,396 |
| 2022 | $4,904 | $292,326 | $105,708 | $186,618 |
| 2021 | $4,365 | $228,049 | $79,281 | $148,768 |
| 2020 | $3,885 | $191,839 | $66,067 | $125,772 |
| 2019 | $2,665 | $167,597 | $0 | $0 |
| 2018 | $2,611 | $164,472 | $0 | $0 |
| 2017 | $2,570 | $161,089 | $0 | $0 |
| 2016 | $2,973 | $134,819 | $0 | $0 |
| 2015 | $2,743 | $122,563 | $0 | $0 |
| 2014 | $2,468 | $111,421 | $0 | $0 |
| 2013 | -- | $92,305 | $0 | $0 |
Map
- 501 Hillpine Way
- 802 Smith Bay Dr
- 605 Valley Hill Dr
- 702 Valley Hill Dr
- 603 Oak Ridge Dr
- 709 E Morgan St
- 512 Dunaway Dr
- 126 Ridgewood Ave
- 521 E Clay Ave
- 437 Dunaway Dr
- 126 Kingsway Rd
- 503 Hedge Row Rd
- 230 Beverly Blvd
- 1016 Malletwood Dr
- 506 Brenda Dr
- 1603 Grand Heritage Blvd
- 310 Kenmore Rd
- 1620 Grand Heritage Blvd
- 1114 Classic Dr
- 165 Picardy Villa Cir Unit 202
- 809 E Clay Ave
- 904 Smith Bay Dr
- 902 Smith Bay Dr
- 501 Stone Dr
- 807 E Clay Ave
- 504 Hillpine Way
- 814 Smith Bay Dr
- 503 Stone Dr
- 905 Smith Bay Dr
- 965 Benninger Dr
- 502 Hillpine Way
- 907 Smith Bay Dr
- 901 Smith Bay Dr
- 909 Smith Bay Dr
- 805 E Clay Ave
- 506 Hillpine Way
- 812 Smith Bay Dr
- 813 Smith Bay Dr
- 505 Stone Dr
- 911 Smith Bay Dr
Ask me questions while you tour the home.